[I'm trying something new: This is a draft of an essay for publication on rootsofprogress.org. I'm posting it here first for feedback. Please comment!]
If progress is slowing down, is it natural? Robert Gordon seems to think so, prophesying “the death of innovation, the end of growth.” Tyler Cowen, in contrast, writes about it as a temporary phase: the subtitle of his book on stagnation says that “America ate all the low-hanging fruit… got sick, and will (eventually) feel better.”
One hypothesis for why stagnation might be inevitable is that “ideas get harder to find.” We’ve already picked the low-hanging fruit; growth will be harder from now on.
A centerpiece of this debate is a paper by Bloom, Jones, Van Reenen, and Webb titled “Are Ideas Getting Harder to Find?” (hereafter, Bloom 2020). But I think this paper has been misunderstood and misinterpreted by those coming to it from outside academic economics.
This essay will explain that paper to the progress community, and clarify its implications for growth and stagnation. To get there, I will sketch the intellectual history of this subfield, and along the way we will gain a much better understanding of TFP (“total factor productivity”).
Ideas do get harder to find. But, it turns out, that alone doesn’t imply stagnation.
Total factor productivity
In the 1950s, Robert Solow made a major discovery about economic growth, just by writing a simple equation and doing a bit of calculus.
The equation was a “production function,” a mathematical formalism that by then had become common in economics. A production function is an equation for the output of a factory, an industry, or the economy as a whole:
, by convention, stands for output (such as GDP). Capital () and labor (), the focus of early 20th-century economics, were the traditional inputs.
We may not know the exact form of the production function, , but we can make some assumptions about it and see where they lead. One question we can ask about are its “returns to scale”: Suppose we double the inputs—is output also doubled, less than doubled, or more than doubled?
One intuition we might have is that if we double both capital and labor, then we also double output: this is the definition of “constant returns to scale.” The intuition pump, known as the “standard replication argument.” is the following thought experiment: Consider a factory that produces 10,000 cars per year. If we build an identical second factory (doubling capital) and staff it with an equivalent second team (doubling labor), the new factory will produce another 10,000 cars per year, thus doubling output.
However, we might also suppose that if we only double capital, or only double labor, we would see diminishing returns, or “decreasing returns to scale.” Twice the labor cannot produce twice the output without twice the machines to run, nor can twice the machines produce twice the output without the extra workers to run them. There is an optimal capital/labor ratio, and deviations from it are less efficient. Put another way, capital and labor are imperfect substitutes.
One popular form of the production function, which satisfies both of these intuitions, is the Cobb-Douglas function:
Where and are each between 0 and 1. In particular, we’ll get constant returns to scale if , so often is defined as and this is written:
In the 1950s, Solow published a few papers in this paradigm that established a new theory of growth. First, he took the Cobb-Douglas function and incorporated a technology multiplier, denoted by :
represents all technical factors that increase the productivity of labor and capital: technology of course, but also improvements in organization, capital allocation, and in some models even education of workers (in other variations of the model, education is factored out as a multiplier on labor). Eventually, it became known as “total factor productivity,” or TFP.
The simplicity of the model is deceptive: analyzing it has deep implications.
So far we’ve been considering total output , but in terms of human well-being, we really care about output per worker: . In the Solow model, the more capital we deploy per worker (), the higher we raise per-worker output. But, because of decreasing returns to scale in the production function, we can’t accumulate capital this way forever. For instance, if equipment requires maintenance that eats up some percentage of the value invested in it, our returns on adding capital will diminish to zero—at some point, all the incremental output generated will go to maintenance, and we will have no net profit from which to invest in more capital. Or, if population is growing, then the growing workforce uses up all our capital accumulation, and the the capital/labor ratio will converge to a stable value. In any case, mere capital accumulation, alone, cannot sustain increasing output per worker—that is, it cannot sustain progress.
But there is another way to raise output per worker: the technology multiplier, TFP. An increase in TFP has two key effects. First, it directly raises output, by its multiplicative effect in the production function. Second, by increasing productivity, it allows more capital per worker to be effectively deployed before hitting the point of diminishing returns. Thus, if we can continue to increase TFP, we can sustain increases in capital per worker and, crucially, in output per worker.
The upshot of the Solow model is that improvements in technical factors, not capital accumulation, are what drive sustained growth. That is, we can have material progress if and only if we have technological progress.
That’s fine in theory, but how big is this effect in practice? How would we even measure TFP? As a catch-all, it isn’t as well-defined as capital or labor, and doesn’t have obvious units like dollars or worker-hours.
Solow came up with a clever way to solve this. Making a few simple assumptions about the form of the production function, and applying a bit of calculus, he was able to calculate the growth rate of TFP in terms of the growth rates of output per worker and capital per worker, and the share of capital in output (the parameter ). If you have this data, and you arbitrarily set TFP = 1.0 in some starting year of interest, you can then calculate the relative values of TFP from that point forward.
Cobbling together reasonable input datasets for the period 1909–49, Solow derived US TFP growth, and found that in those four decades it had almost doubled:
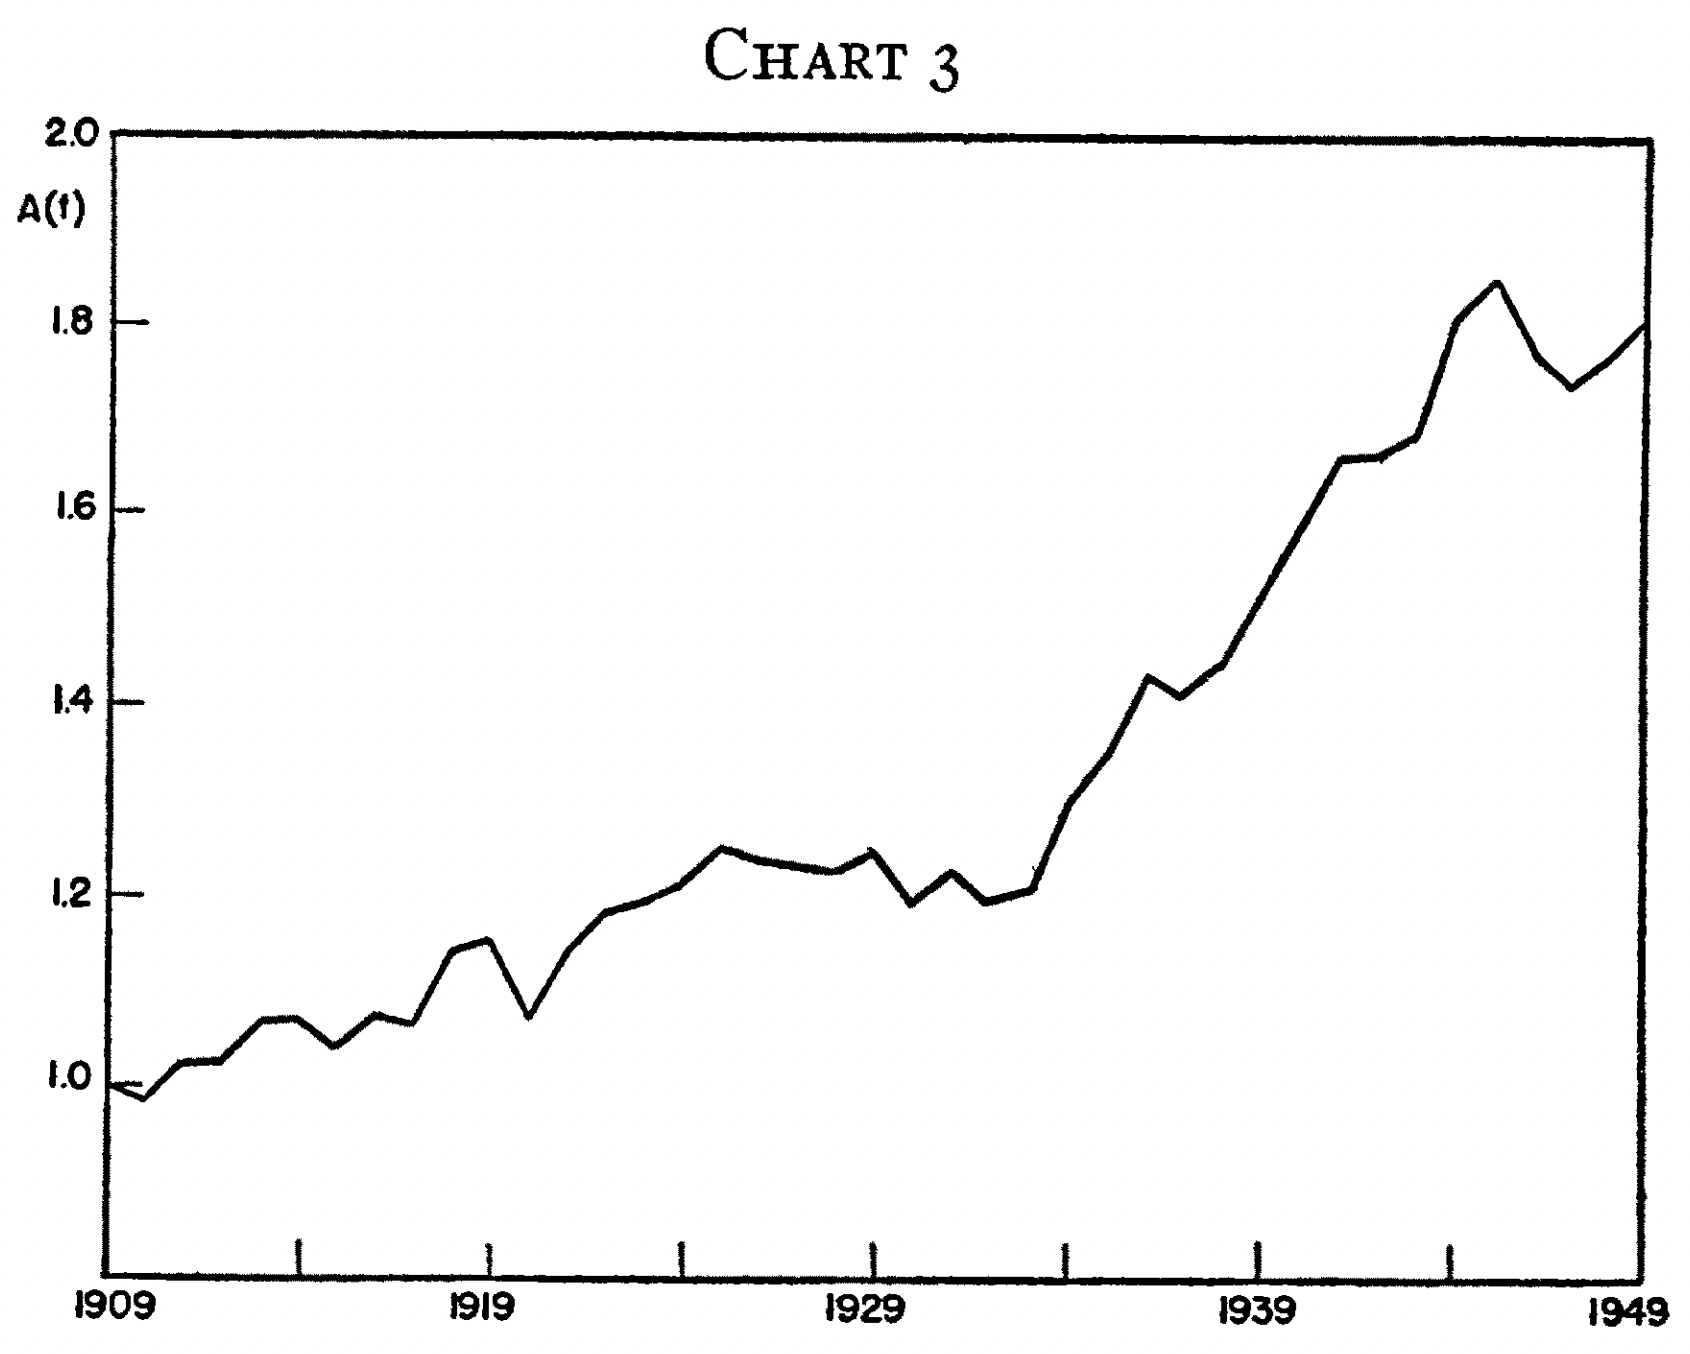
Output per worker had more than doubled, while capital per worker had only increased about 30%. Solow attributed 87.5% of the increase in output per worker to technical factors, and only 12.5% to capital accumulation.
All of this was surprising to Solow and his contemporaries. Until that point, much of economics was focused on capital accumulation as the path to growth. But Solow showed that capital could not drive growth theoretically, and was not driving it empirically. In both the models and the data, technology took on this role instead. This work was highly influential: it established what is known as neoclassical growth theory, and earned Solow a Nobel prize in 1987.
But where does TFP come from?
Ideas and objects
The formal mathematical models of economics proceed more slowly than our looser intuitions. Everyone understood that TFP somehow represented technology or innovation. But Solow’s model did not attempt to represent where TFP comes from or what determines its growth rate. To simplify the model for analysis, he took TFP to be “exogenous”: that is, the model contains no formula to determine its value. The value at any time is simply a given, an input that comes from outside the model.
This, then, was a new and important part of the research agenda: how can we understand the origins and determinants of TFP?
From the 1960s on, many papers addressed this question, but the right formal model proved elusive. Some models had technology provided by the government as a pure public good (e.g., Shell 1966). Others focused on the accumulation of “human capital” (skills and education) rather than technology as such (Uzawa 1965, Lucas 1988). Kenneth Arrow, in a well-known 1962 paper, proposed a model of “learning by doing”, in which firms improve their techniques as a by-product of production (based on T. P. Wright’s 1936 observation of “experience curves” in airplane manufacturing).
What all of these models omitted was the fact, clear from economic history, that technology is often developed through private R&D by profit-seeking inventors and firms. Arrow himself noted at the end of his paper:
It has been assumed here that learning takes place only as a by-product of ordinary production. In fact, society has created institutions, education and research, whose purpose it is to enable learning to take place more rapidly. A fuller model would take account of these as additional variables.
But in seeking that fuller model, economists ran into a dilemma. If technology was a pure public good—freely available to all—then there was no incentive for private actors to produce it, and no way for them to recoup their investments in doing so. On the other hand, if it was a pure private good, it seemed like just another form of rival capital—in which case it arguably should exhibit constant returns to scale, not increasing returns, when taken together with traditional forms of capital and with labor. (I am oversimplifying the problem somewhat; other papers ran into more subtle, technical issues. For instance, in some learning-by-doing models, advantages can accrue to the largest companies in a way such that each industry tends towards monopoly.)
Of course, it was clear that technology fit neither of these classifications exactly. You can see papers from the ‘60s and ‘70s struggle with this. William Nordhaus (1969) refers to “the public good character“ of inventions—“except under extreme legal arrangements like a patent system.” Karl Shell (1973) says that because knowledge is hard to produce but easy to disseminate, and because it can be shared by everyone, “we must think of technical knowledge as a public good.” In an earlier (1966) paper, though, he had added in a footnote:
In practical applications, the distinction between private and public goods is fuzzy. What is considered to be a public good under one set of legal and social arrangements may be considered to be a private good under a different set of arrangements.
The conceptual muddle was untangled in a Nobel-winning 1990 paper by Paul Romer. He did it by applying two concepts that were, at the time, known within the subfield of public finance, but not broadly applied in other subfields: rivalry and excludability. A good is rival if one person’s consumption of it diminishes the amount available to others: normal physical goods such as a loaf of bread are like this, but broadcast radio is not. It is excludable if it is possible to prevent others from consuming it: again, normal physical goods are like this, but unfenced common areas, such as fishing waters, are not.
These concepts tease apart two distinct dimensions that are entangled in the one-dimensional classification of “public” vs. “private.” “Private goods” are both rival and excludable. “Public goods” are neither (e.g., national defense). But a good can be one without the other. Romer explains: “Rivalry and its opposite nonrivalry are assertions about production possibilities. Excludability depends on a policy choice about rules.”
In particular, ideas, by their nature, are nonrival: they can be replicated at trivial marginal cost and used by everyone simultaneously. But they can be made at least partially excludable: for instance, via patents.
These concepts allow us to sharpen Shell’s “fuzzy distinction.” The excludability afforded by IP law allows firms to profit from R&D and thus to recoup their investment in it. But the nonrivalry of ideas, which made previous economists want to think of them as a “public good,” explains an important historical pattern: that of both population and living standards increasing together. Romer:
The simple point that goes back to Malthus is that if is the stock of any rival resource, and is the number of people, the per capita stock of resources, , falls with . Unless there is some offsetting effect, this means that the individual standard of living has to decrease when the number of people increases.
But:
… if represents the stock of ideas it is also the per capita stock of ideas. Bigger means bigger so bigger means more per capita.
(Emphasis added.)
Mathematically, if the production function exhibits constant returns to scale, the function (where is ideas) exhibits increasing returns. If we double labor, double capital, and double the technology multiplier, we more than double output.
More generally, no matter what our model of the economy, we can divide the factors of production into two groups: rival and nonrival. Call the former “objects” and the latter “ideas.” The production function exhibits constant returns to scaling objects alone, but increasing returns to scaling objects and ideas together.
How does TFP grow?
Romer’s work clarified the conceptual framework that lets us understand how technological development generates increasing returns to scale and thus economic growth. And, according to Chad Jones (2019), it reintroduced economic growth “as an active field of study to the economics profession”:
The first key contribution that Romer made to the study of economic growth was to remind the profession of the ultimate importance of this topic. At a time when much of macroeconomics was devoted to studying inflation and unemployment, Romer emphasized the centrality of questions such as: “what determines the long-run rate of economic growth in living standards?”
But how exactly does TFP grow, and why?
In contrast to Solow’s “exogenous” variable, Romer wanted to incorporate a formula for TFP into his model, thus making it “endogenous” (for this reason, the framework that resulted is called “endogenous growth theory”). The formula he chose was based on patterns from long-term economic history.
GDP per capita has growing exponentially in the West for at least 150 years. Over the longer term, it has been growing super-exponentially. This can be seen in long-term GDP estimates such as those of Maddison:
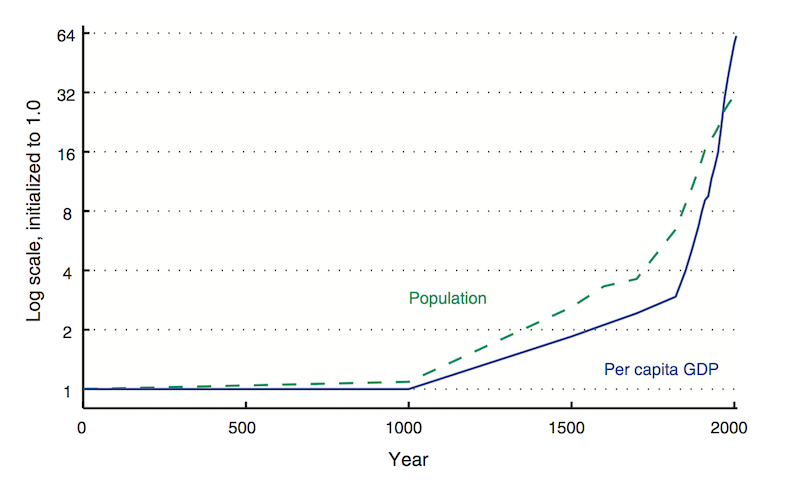
Of course, estimates like these are sketchy, based on very rough reconstructions from scant historical evidence. Even so, we can be confident in the broad pattern. In the same essay, Romer writes:
My conviction that the rate of growth in GDP per capita at the technological frontier had to be increasing over time sprang from a simple calculation. Suppose the modern rate of growth of real GDP per capita (that is the growth rate after taking out the effects of inflation) is equal to 2% per year and that income per capita in year 2000 is $40,000. If this rate had prevailed for the last 1,000 years, then in the year 1000, income per capita measured in the purchasing power of dollars today would have been $0.0001, or 0.01 cents. This is way too small to sustain life. If the growth rate had been falling over time instead of remaining constant, then the implied measure of GDP per capita in the year 1000 would have been even lower.
He concludes:
Reasonable people can differ about what the future holds, but the simple calculation that first got me thinking about this (and which no doubt influenced how Maddison did the backward projections to come up with his estimates) leaves no room for doubt about what happened in the past. The rate of growth of GDP per capita has increased over time.
Given this context, Romer made a simplifying assumption for his model: he assumed that TFP grows exponentially. Specifically, he wrote a differential equation:
(the dot in indicates a time derivative). This implies a constant exponential growth rate of , where is the amount of human capital devoted to research, and is “a productivity parameter”—call it “research productivity”. (Romer 1990 uses , Jones 2019 uses , and Bloom 2020 uses . Economists don’t seem too picky about which Greek letters they use as long as they’re consistent within a paper. They even use as a variable, which is disconcerting to anyone used to math and physics. I’m going to use consistent notation in this essay, which means I will transliterate equations from some papers.)
This formula was chosen for analytical convenience as much as anything else. Romer’s goal was to model how technology could be created by private R&D, not to predict how it would grow over time. He stated in the paper that exponential growth “is more like an assumption than a result of the model,” and he pointed out the other assumptions implied by this formula, one of which was “that the larger the total stock of designs and knowledge is, the higher the productivity of an engineer working in the research sector will be”:
According to this specification, a college-educated engineer working today and one working 100 years ago have the same human capital…. The engineer working today is more productive because he or she can take advantage of all the additional knowledge accumulated as design problems were solved during the last 100 years.
He cautioned that:
Whether opportunities in research are actually petering out, or will eventually do so, is an empirical question that this kind of theory cannot resolve. The specification here, in which unbounded growth at a constant rate is feasible, was chosen because there is no evidence from recent history to support the belief that opportunities for research are diminishing. Moreover, linearity in is convenient analytically, and assumptions about what will happen in the far future for values of that are very large relative to the current level have very little effect on the question of interest…
But it turns out there is a problem with this assumption, and we don’t have to look to the far future to see it. After Romer’s paper, Chad Jones (1995) pointed out that if instead of the last thousand years, we zoom in on the 20th century, we find that R&D investment increased by a large factor, while TFP growth was roughly constant:
For example, according to the National Science Foundation (1989), the number of scientists and engineers engaged in R&D in the United States has grown from under 200,000 in 1950 to nearly 1 million by 1987; per capita growth rates in the United States exhibit nothing remotely similar to this fivefold increase.
If Romer’s formula were accurate, then we would have seen a significant speedup in TFP growth, but we see nothing of the kind.
Another way to frame the problem is that Romer’s formula implies that the R&D base we had ~200 years ago—a handful of gentleman scientists and eccentric inventors, working at their kitchen tables and in backyard sheds (to caricature it)—should, alone, be able to keep up the growth rates of that period. Alternately, given the exponential increase in the research population (even faster than general population growth, as the share of population devoted to research has also been increasing), we ought to have seen an exponential increase in the growth rate of TFP, which implies super-exponential growth. Scott Alexander illustrates the paradox:
The economic growth rate in 1930 was 2% or so. If it scaled with number of researchers, it ought to be about 50% per year today with our 25x increase in researcher number. That kind of growth would mean that the average person who made $30,000 a year in 2000 should make $50 million a year in 2018.
Or: in 1930, life expectancy at 65 was increasing by about two years per decade. But if that scaled with number of biomedicine researchers, that should have increased to ten years per decade by about 1955, which would mean everyone would have become immortal starting sometime during the Baby Boom, and we would currently be ruled by a deathless God-Emperor Eisenhower.
Or: the ancient Greek world had about 1% the population of the current Western world, so if the average Greek was only 10% as likely to be a scientist as the average modern, there were only 1/1000th as many Greek scientists as modern ones. But the Greeks made such great discoveries as the size of the Earth, the distance of the Earth to the sun, the prediction of eclipses, the heliocentric theory, Euclid’s geometry, the nervous system, the cardiovascular system, etc, and brought technology up from the Bronze Age to the Antikythera mechanism. Even adjusting for the long time scale to which “ancient Greece” refers, are we sure that we’re producing 1000x as many great discoveries as they are? If we extended BJRW’s graph all the way back to Ancient Greece, adjusting for the change in researchers as civilizations rise and fall, wouldn’t it keep the same shape as does for this century? Isn’t the real question not “Why isn’t Dwight Eisenhower immortal god-emperor of Earth?” but “Why isn’t Marcus Aurelius immortal god-emperor of Earth?”
(In fact, if GDP were truly growing at a percentage rate proportional to its size, growth would be not exponential but hyperbolic—that is, it would hit an infinite value in finite time. Kremer (1993), and another Scott Alexander post, explore such models—which fit fairly well until about the 1960s, but then diverge from historical data.)
Clearly, we need to revise our formula for TFP. To address the problem, Jones (1995) suggested a generalization of Romer’s model:
The only difference is that we have added a parameter . Romer’s model corresponds to the assumption of , which gives exponential TFP growth with constant research effort—but this assumption is arbitrary. Maybe is between 0 and 1, in which case research would show positive but diminishing returns to technology development. It could even be that , in which case the growth rate would decrease as technology advanced. In other words, “ideas” would be getting harder to find.
There are multiple reasons why this might be the case. It might be that research can be modeled as a random search process, where new inventions are valuable and patentable only if they are better than the state of the art (Kortum 1997). (In the specific case of pharmaceutical research productivity, Scannell (2012) calls this the “better than the Beatles” problem.) Or, it could be that as science and technology advance, the burden of knowledge increases. The more we learn, the longer a researcher has to study in order to reach the frontier, where they can make progress; and the more they have to specialize, which makes it harder to forge connections across disparate fields.
In any case, we can’t simply assume , as did Romer and others. We need a deeper empirical investigation of this part of the model.
Why formalize?
If you’re not an economist (or even if you are?), by now you might be wondering: What is the point of all these models? Why bother with them when they are obviously—deliberately—oversimplified? What do they tell us that we didn’t already know? And how do you get a Nobel prize for writing an equation as simple as , or —especially if it turns out to not even be correct?
The Economist, reviewing a 2006 book about Romer and endogenous growth theory, says:
At one point in Mr Warsh's book, Mr Romer is quoted comparing the building of economic models to writing poetry. It is a triumph of form as much as content. This creative economist did not discover anything new about the world with his 1990 paper on growth. Rather, he extended the metre and rhyme-scheme of economics to capture a world—the knowledge economy—expressed until then only in the loosest kind of doggerel. That is how economics makes progress.
That is lovely as metaphor, but unsatisfying as explanation. There must be something more to progress in economics than satisfying the aesthetic sense of economists. And I suspect that Romer would take issue with the statement that he did not discover anything new about the world.
Romer has a different explanation: models force us to put our propositions in precise language. Thus they clarify our thinking:
It is not enough to say “_________ explains why Malthus was wrong,” and to fill in the blank with such words as “technological change” or “discovery” or “the Enlightenment” or “science” or “the industrial revolution.” To answer the question, we have to understand what those words mean.…
… it is not enough to say that “many poor countries fail to take advantage of rapid catch-up growth because they ____________” and then fill in the blank with such words as “have bad institutions” or “are corrupt” or “lack social capital” or “are held back by culture.”
Elsewhere he says:
A sign of a good mathematical model is that once you understand it, you can state the answer it suggests very simply. These answers are the final output from the modeling exercise. The models are intermediate inputs.
Further, models let us test our hypotheses against data, in a way that is not as exact as in the physical sciences, but is still more rigorous than if we had no equations at all.
Here’s an example of how this works. Jones & Romer (2010) say that “In 1961, Nicholas Kaldor stated six now famous ‘stylized’’ facts”:
- Labor productivity has grown at a sustained rate.
- Capital per worker has also grown at a sustained rate.
- The real interest rate, or return on capital, has been stable.
- The ratio of capital to output has also been stable.
- Capital and labor have captured stable shares of national income.
- Among the fast growing countries of the world, there is an appreciable variation in the rate of growth “of the order of 2–5 percent.’’
Later they say:
One of the great accomplishments of neoclassical growth theory is that it produced a single model that captured the first five of Kaldor’s facts. Five different models, one for each fact, would have been a much less significant intellectual achievement.
This is why the models make unrealistic assumptions. The point is not to include as many terms as possible, to hew as close as possible to the fine details—as you might want, in, say, a weather forecasting model, where the purpose is to make the most accurate possible prediction. The point is to come up with the simplest model that still explains the stylized facts.
When we do that, we can have some confidence that we have identified the essential factors that drive the dominant trends. The rest is noise.
Ideas getting harder to find
Now we have the full context to understand “Are Ideas Getting Harder to Find?” and its implications.
First, we can understand the terminology. “Ideas” ultimately means TFP, using the term popularized by Romer to highlight the nonrival nature of this factor of production, and it refers to the variable from Solow (1956) (although in this paper various sub-fields are investigated, and different “idea” metrics are chosen as appropriate). This is why the units of “ideas” are chosen “so that a constant flow of new ideas leads to constant exponential growth in .” The authors did not begin with the concept of “ideas” and then decide that TFP was the best way to measure them—they began with TFP and adopted the term “ideas” as a catchy shorthand.
“Getting harder to find” means : a phenomenon of negative returns to research productivity from the advancement of technology itself. (Note, this notation is from Jones 1995; Bloom 2020 has a different form using .)
In particular, we can understand why “research productivity” is defined the way it is. This threw me off the first time I read the paper. To understand why, consider an analogy: Suppose a small company has 5 sales people, and each can close $1M of sales per year. The company is growing fast, doubling every year. The next year, they have 10 sales people, each can still close $1M of sales per year, and the company has still managed to maintain that growth rate of 100% per year. If you told the VP of Sales that “sales productivity” was the growth rate of total sales divided by the size of the sales team, and that “productivity” was half of what it was a year ago, the VP would tell you that your expectations were unrealistic and your definition of “productivity” was nonsensical. Clearly “sales productivity” should be defined as the absolute, not relative, amount of revenue per sales person. But now with the full context, I can see that the term “research productivity” is used as a way to identify whatever factor is multiplied by “research investment” to give the growth rate of TFP. Again, an intuitive label has been given to a term in a formula, rather than the variable being defined in order to measure a concept.
With these terms in mind, we can avoid getting confused by the title. “Ideas getting harder to find” has been misunderstood in various ways by those unfamiliar with the literature and with the history above. But as the authors pointed out, a more accurate (albeit less catchy) title would have been “Is Exponential Growth Getting Harder to Achieve?” And ultimately they want to know, does exponential TFP growth require ever-increasing R&D inputs?
Further, we can understand the motivation for this aim. The model of exponential TFP growth from constant human capital had been laid down in the paper that established endogenous growth theory, and even though it was a simplifying assumption chosen in part for analytical convenience, it had stuck, and it was the standard that needed to be addressed.
We can also understand the paper’s unique contribution. The basic insight that the 20th-century data contradicts the Romer assumption was not new; Jones had published it over twenty years earlier. What this paper added was a wealth of data and analysis at the micro level, including a handful of case studies and a broad set of firm-level data, in order to see whether they tell the same story as the aggregate data previously presented.
And most importantly, we can understand the implications of for growth. In particular, it does not imply that growth will be sub-exponential.
I repeat, ideas getting harder to find does not imply that exponential growth is impossible.
In fact, Bloom 2020 shows us how exponential growth is possible, both empirically and theoretically. Empirically, it looks at a number of cases in which (roughly) exponential growth has been sustained, such as in Moore’s Law. Theoretically, the model has clear conditions under which growth rates are sustained: they happen when our R&D inputs also increase exponentially, at a rate fast enough to offset . (The inputs here are either the number of researchers or, in a variant of the model, “effective researchers.” The latter term is defined as total R&D investment, deflated by the wage rate—which could pay for researchers, but also for more and better lab equipment, etc.)
And of course, you can increase your R&D inputs exponentially as long as your economy and your population are growing exponentially. This simply corresponds to a constant share of income and of the workforce going to R&D. Jones himself (2019) explains the model, not as a way to understand a growth slowdown, but as a way to understand sustained exponential growth:
Why has the United States grown at 2 percent per year for the past 150 years? According to this theory, an important part of the explanation is that research effort has itself been growing exponentially. By any measure, we have been throwing ever larger quantities of resources into the hunt for new ideas. Just as more workers produce more cars, more researchers generate more ideas. Exponential growth in research effort leads to a growing stock of knowledge, and the fact that this knowledge is nonrival translates this into growing income per person.
Kortum (1997) agrees:
Diminishing opportunities need not imply stagnant productivity, however, as they may be offset by rising research effort.…
… In fact the number of researchers must rise exponentially to generate a constant flow of new patented inventions.
This can happen if “the value of patented inventions rises over time causing researchers to expend ever greater resources to discover them.”
In fact, in Jones (1995) and in other papers based on it, including Bloom (2020), the long-term growth rate of the economy is proportional to the population growth rate: a growing population enables a growing community of researchers, which drives growing TFP. (Incidentally, world population growth rate has been slowing for over 50 years—but this does not explain stagnation, because the number of researchers, and total R&D investment, has been increasing. It is, however, a concern for the long term, since eventually the number of researchers will be limited by total population.)
I emphasize this because of the way that Bloom (2020) has been discussed in the progress community and adjacent intellectual circles. Sometimes “ideas getting harder to find” is used as an explanation for stagnation, implying a Robert Gordon–esque future of slow growth. For instance, Holden Karnofsky says that “we should expect further stagnation,” and that there's no need for any hypothesis that any previous era was better at innovation in any significant way. On the other hand, those who resist the idea that stagnation is natural push back against the premise that ideas get harder to find. For instance, Ben Southwood suggests that we’re actually getting worse at finding them. (I pick on Holden and Ben, of course, because they are some of the smartest thinkers and best writers in the discussion.)
All of these treat “ideas getting harder to find” as a possible explanation for stagnation, competing with other explanations like regulation or culture. But in the Jones/Bloom model, is just one factor in the production function for TFP, which can be counteracted by other factors. Put another way, ideas get harder to find, but at the same time, we get better at finding them. The TFP growth rate over time is determined by the balance of these forces, not by one or the other of them alone.
In the Jones/Bloom model, the force that counteracts is the growth in the number of researchers (or “effective researchers”). In other words, we can “get better” at finding ideas just by throwing more brains (and/or money) at the problem. But if we step back a bit, we can imagine other ways that we might get better at finding ideas, in particular through technology itself: spreadsheets and Python notebooks, Arxiv and Google Scholar, space telescopes and particle colliders, etc.
In other words, all of the same factors of production that go into producing physical goods—labor, capital, and technology—also go into producing technology itself. And so, in principle, we should be able to continue to expand production of technology even in the face of ideas getting harder to find, just as we expand the production of goods even in the face of physical resources getting harder to find. Indeed, note that all the metaphors we use for ideas getting harder to find—low-hanging fruit, mining a vein of minerals, fishing out a pond—are metaphors for physical resources! Calling “peak ideas” is not unlike calling the peak of a physical resource: it’s sometimes true in specific fields, but at the broadest level, it seems like a bad prediction on any but the longest timescales.
The terms of the debate
I won’t attempt to settle the stagnation debate here. But I want to lay out what a complete argument should look like.
First, any hypothesis should attempt to explain all of the key facts:
- Super-exponential growth on the scale of millenia
- Exponential growth on the scale of the last ~150 years
- Slowing growth (maybe linear?) over the last ~50 years
If “ideas getting harder to find” were the only operative factor, then growth rates would have been slowing down for centuries. Why wasn’t progress fastest in pre-history? (Think of all the low-hanging fruit!) Our explanation for slowing growth rates should be something that changed in the mid-20th century, not a fundamental fact about progress that presumably has always been true.
Then, I think you have to have some hypothesis (even if only the null hypothesis) about all the terms in the production function. If you hypothesize that ideas get harder to find, you also need a hypothesis about our ability to find them. For recent history, you could argue that the rate at which ideas get harder to find has increased, that the rate at which we get better at finding them has decreased, or both.
What Bloom (2020) shows is that “research productivity” is declining, at least in recent decades. But, like TFP, “research productivity” is a residual: it’s what is left when you divide TFP growth by the increase in R&D inputs. And like TFP, it may not be a single thing. Nor is it necessarily related to scientists and labs: even though we use the language of “ideas” and “research,” ideas don’t show up in TFP until they are actually implemented and widely distributed in the economy. Anything along that entire pipeline could contribute to a decline. The models and evidence discussed so far are consistent with the hypothesis of an R&D overhang caused by some inefficiency in getting inventions to market.
It seems likely to me that there is some “low-hanging fruit” effect and that that is a significant part of declining “research productivity.” But it is not at all clear how much of the decline low-hanging fruit represents, or whether it can account for the recent slowdown. Other factors could be significant—and not all of them are represented in our models.
In particular, economists are in broad agreement that institutions are fundamental and have a major effect on growth rates. Our models don’t yet have a term for this. But our scientific, corporate, legal, and cultural institutions have changed massively since the mid-20th century. This seems to me like a prime place to look for the cause of recent stagnation.
Notes on sources
The best overview of this history is Chad Jones, “Paul Romer: Ideas, Nonrivalry, and Endogenous Growth” (2019). (I am told that David Warsh's Knowledge and the Wealth of Nations also tells the story of Romer's discovery beautifully, although I haven't had time to read it.)
The crucial Solow papers are “A Contribution to the Theory of Economic Growth” (1956) and “Technical Change and the Aggregate Production Function” (1957). The first is all math; he just analyzes many different models. The model that became standard was not even the main focus of the paper; it's presented among others in a section on “Extensions” towards the end of the paper. The second paper is the one where he explains how to calculate TFP, and presents the first ever estimates of it. Marginal Revolution University has a video series explaining a simplified version of the Solow model.
Kenneth Arrow, “The Economic Implications of Learning by Doing” (1962), is a good read to get a sense of the discussion that took place after Solow but before Romer.
Romer's Nobel-winning paper is “Endogenous Technological Change” (1990). I also got a lot out of reading Romer's blog, especially “Speeding-up and Missed Opportunities: Evidence,” “Speeding Up: Theory,” and “The Deep Structure of Economic Growth.” Incidentally, Romer credits Tyler Cowen for playing a role in his insight about nonrivalry.
Chad Jones published two papers in 1995 discussing the problem with Romer's assumption. The one I've linked to above, which is more theoretical, is “R&D-Based Models of Economic Growth.” The other, which focuses more on the data, is “Time Series Tests of Endogenous Growth Models.”
And again, just for completeness, there's: Bloom, Jones, Van Reenen, and Webb, “Are Ideas Getting Harder to Find?” (2020).
Relevant articles from Matt Clancy's excellent resource New Things Under the Sun include: Innovation (mostly) Gets Harder, Are ideas getting harder to find because of the burden of knowledge?, More People Leads to More Ideas, and Combinatorial innovation and technological progress in the very long run.
If you're interested in the very long-run growth estimates and models, the one I cited is Michael Kremer, “Population Growth and Technological Change: One Million B.C. To 1990” (1993). Also interesting was Robin Hanson, “Long-Term Growth As A Sequence of Exponential Modes” (2000). Again, beware that these are based on shaky population estimates; for a critique ,see Timothy Guinnane, “We Do Not Know the Population of Every Country in the World for the Past Two Thousand Years” (2021).
Finally, for a broader perspective, I enjoyed Jones and Romer, “The New Kaldor Facts: Ideas, Institutions, Population, and Human Capital” (2010).
Good piece.
One of the main issues I have with economic approaches to knowledge production like Romer's is that they approach Knowledge as a singular entity that produces an aggregate economic output, as opposed to a set of n knowledges that each have their own output curves. In practice (and in the technological forecasting lit), there's a recognition of this fact in the modelling of new technologies as overlapping S-curves:
The S-curve approach recognizes that there is a point where the ROI for continued investment in a particular technology tapers off. So this means that we don't run out of Ideas, we just overinvest in exploitation of existing ideas until the cost-to-ROI ratio becomes ridiculous. Unfortunately, the structure of many of our management approaches and institutions are built on extraction and exploitation of singular ideas, and we are Very Bad at recognizing when it's necessary to pivot from exploit to explore.
Even worse, this is not only true for the structure of our industrial-commercial research, but for our basic research apparatus as well. Grants are provided on the basis of previous positive results, as opposed to exploration of net-new areas -- resulting in overexploitation of existing ideas and incentivized research stagnation.
In practice, you can think of it like this comic...
except instead of a circle, our knowledge distribution looks like this
Thanks. I generally agree with all these points, but do they change any of the conclusions? These complexities aren't represented in the models because, well, they would make the models more complex, and it's not clear we need them. But if it made a crucial difference, then I'm sure this would get worked into the models. (It's actually not uncommon to see models that break out different variables for each invention or product, it's just that those details don't end up being important for high-level summaries like this.)
As with any metric, it comes down to what you're looking to diagnose -- and whether averages across the total system are a useful measure for determining overall health. If someone had a single atrophied leg and really buff arms, the average would tell you they have above-average muscle strength, but that's obviously not the whole story.
Same goes for innovation: if idea production is booming in a single area and dead everywhere else, it might look like the net knowledge production ecosystem is healthy when it is not. And that's the problem here, especially when you factor in that new idea production is accelerated by cross-pollination between fields. By taking the average, we miss out on determining which areas of knowledge production need nurturing, which are ripe for cross-pollination, and which are at risk of being tapped out in the near future. And so any diagnostic metric we hope to create to more effectively manage knowledge ecosystems has to be able to take this into account.
I agree that if you want to understand where there might be problems/opportunities, you can't just look at averages.
The most exciting prospect here, imo, is building capacity to identify underresearched and underinvested foundational knowledge areas, filling those gaps, and then building scaffolding between them so they can cross-pollinate. And doing this recursively, so we can accelerate the pace of knowledge production and translation.
Also strongly recommend the adjacent possible work if you haven't seen it yet.
https://www.technologyreview.com/2017/01/13/154580/mathematical-model-reveals-the-patterns-of-how-innovations-arise/#:~:text=The%20adjacent%20possible%20is%20all,the%20space%20of%20unexplored%20possibilities.
What a helpful and comprehensive guide to the economic study of human capital and productivity. Thank you for writing this! I like the idea of a model as a good way of testing various hypotheses. Models are undefeated for inferring causality. As a matter of prediction or even for generating hypotheses, I'm less optimistic about models.
Pulling on the institutional thread does seem like the right move, as opposed to ideas. They do at least roughly map to the slow pre-enlightenment, fast modernity and slowing post-modern pattern of progress. Still, privileging institutions over individuals as the most important factor doesn't make much intuitive sense to me, since each new idea only happens once. It's possible that institutions are getting in the way of idea execution (regulation, etc.), but missing key ingredient seems to be coordination more than anything.
The "one-time-boom" version of the ideas are getting harder to find argument is one you hear often that does seem to map to the general pattern of progress and is Cowen's favored variant. I'm partial to the idea that in the wartime hurry to push innovation we reordered our institutions to achieve great short-run gains at the expense of a kludgy emergent system that was working fairly well. Over-optimization of talent sorting and centrally directed R&D may extract progress from promising individuals at the same time that it destroys the system for creating promising individuals. Somewhere between a "Seeing Like a State" argument and a more individual and metaphysical explanation.
Consider Cesar Hidalgo's work in this analysis: Why Information Grows and his new paper Knowledge is non-fungible.
Thanks Gale! In a nutshell, what are the most important takeaways from those pieces?
I think TFP is not really ideas. It is deployment of production methods. New ideas give us new production methods, but they don't really help us deploy them. For deployment, we need a lot of effort (1% inspiration, 99% perspiration) and also high-quality institutions.
How do you explain the TFP drop in Venezuela? Did they suddenly lose a bunch of ideas? No, their institutions deteriorated and their deployed production methods declined in quality.
Same in the US. The creation of the NRC reduced the quality of the production methods we could deploy. NEPA too. Lots of other things one could cite. Simply letting us use the ideas we already have as effectively as possible would increase TFP significantly.
So explaining your three data points:
Another way to put it is: are ideas getting harder to use? We know that if we put the magic rocks together, they get hot and can be used to generate steam and electricity. But if we're not allowed to make effective use of that information, it screws us almost as much as if we didn't have it in the first place.
I think that story fits, too. And Romer/Jones would seem to be sympathetic as well. From the “New Kaldor Facts” paper mentioned above (emphasis added):
I am curious to hear from people who are skeptical of the crucial role of institutions, or who ignore it, and I'm curious what evidence would resolve the disagreement.
Not to be a double contrarian, but I am also skeptical of a lot of econ research on institutions. Ha!
That would make a good topic for a separate post/debate somewhere! In any case, the models discussed here don't have terms for institutions, so clearly there is something important they're not yet capturing…
One thing I'd like to see is a discussion of the potential for measurement error. For example, software is notably deflationary yet we don't see that in the statistics due to how we count. (We still don't really know how to value the contribution of software to GDP.) Bloom (2020) may just be measuring the wrong outputs for the current type of progress. For example, if publications or patents are a weaker signal for ideas than in the past, the methodology breaks down.
I agree in general about the measurement challenge. However, one strength of Bloom (2020) is that they look at a variety of areas using different metrics: Moore's law, agricultural productivity, etc. (They don't really look at patents, in part because it's hard to know what patents mean/represent.) In any case, it's not just GDP. The fact that there are similar patterns across different metrics is evidence that there's something real going on.
Holden Karnofsky and Scott Alexander go further, albeit with less solid quantitative support, and extend the pattern to art and general human accomplishment. E.g., here's Scott (this comes right after the block quote above):
Good point, though I don't find looking at a selection of areas as too convincing. I could just as easily choose areas with consistent exponential growth that I would guess don't look like this, like solar panels or genome sequencing. Even if things were getting better on average you would expect some things to get less efficient over time too. (for example, think about that inflation components chart people share all the time)
One last thing: we would probably want to look at output and not inputs. Robert Gordon's sort-of nemesis, Chad Syverson, has done work on how some big super-trends take a long time to develop and even have an impact on the world, like steam rail and electricity. Might be worth looking into as a counterpoint to the Gordon thesis.
Well, the point of a lot of this is to look at outputs as a function of inputs. That is what Bloom 2020 is looking at. You need some measure of inputs (they basically use R&D spending, deflated by the wage rate) and some measure of output (GDP, transistor density, crop yields, etc.) and then you figure out the quantitative relationship.
If solar panels or genome sequencing don't look like this, that would be very interesting! My guess would be that they do.
Revision history: