In this post I describe the intra-day structure of supply for different electricity sources, and I explore the consequences of the expansion of Wind and Solar electricity production. The increase of renewable “non-manageable” electricity supply will very likely produce “excess generation” in several hours of the day; that electricity will be lost if not stored.
One possibility to deal with this loss is large scale electricity storage (see this project in Portugal), but if electric vehicles (EV) become widespread that provides enormous decentralized electric storage capacity.
As a consequence, I argue that intelligent charging of EV batteries is a key ingredient in the energy transition; we are very fortunate of the complementarity between intermittent energy production and EV storage capacity. Finally, I suggest an incentive scheme for fast deployment of recharge points and a mandate for intelligent charging software in all EVs.
Manageable and non-manageable electricity supply
First of all, a data analysis is performed in the Iberian (=Spain and Portugal) hourly electricity generation data as provided in this Kaggle dataset (we use only 2018 data). The dataset includes the following information: hourly total generation of electricity disclosed by more than twenty generation sub categories. Among them there are: Solar, Wind [On-shore and off-shore], Hydro [reservoir, hydro pumped storage consumption, hydro run-of-river and poundage], Nuclear, Waste and Biomass, and Fossil (classified in many subcategories). Additional information that I don’t use in this note (meteorological, electricity prices, etc) is also included in the dataset. Replication materials for this post are available here. Additional resources on the modelling of the simultaneous expansion of renewable energy and EVs can be found in this totally unrelated (but also Spanish!) reference.
Total electricity production (that for the quasi-isolated Iberian market is similar to demand) can be divided in two groups: Non manageable (“on the run”) electricity supply and manageable supply.
Non-manageable electricity production comes from sources whose marginal costs are close to zero; it is a supply that if available is always used: it is mainly Wind, Solar and Nuclear power plants[1] , but other minor sources are also non-manageable[2]. Nuclear power plants deliver a very predictable (but inelastic) flow of electricity while Solar and Wind are volatile. Demand is also variable both intra-day and across days.
Manageable electricity production is Fossil, Hydro electricity from reservoirs (HydroRes), and waste and biomass: these sources enter in the market pool depending on price, by order of bid (approximately marginal cost[3]) and they cover the gap between demand and the non-manageable (zero marginal price) supply.
I summarize the above discussion in the following equation:
Demand [approx. = to total generation]=Non manageable (“On the run”) supply [Wind, Solar, Nuclear, etc]+Manageable supply [Reservoir hydro, Waste and Biomass, Fossil]
In Graph 1 the Demand the main supply sources are presented by row, while seasons (“Cold” season is December, January and February, “Hot” is June, July and August and “Temperate” is the rest of the year) are considered by column. Each panel depicts the distribution of supply (in thousands of Mwh, the red point is the mean of the distribution) by day hour (x-axis, 0-23).
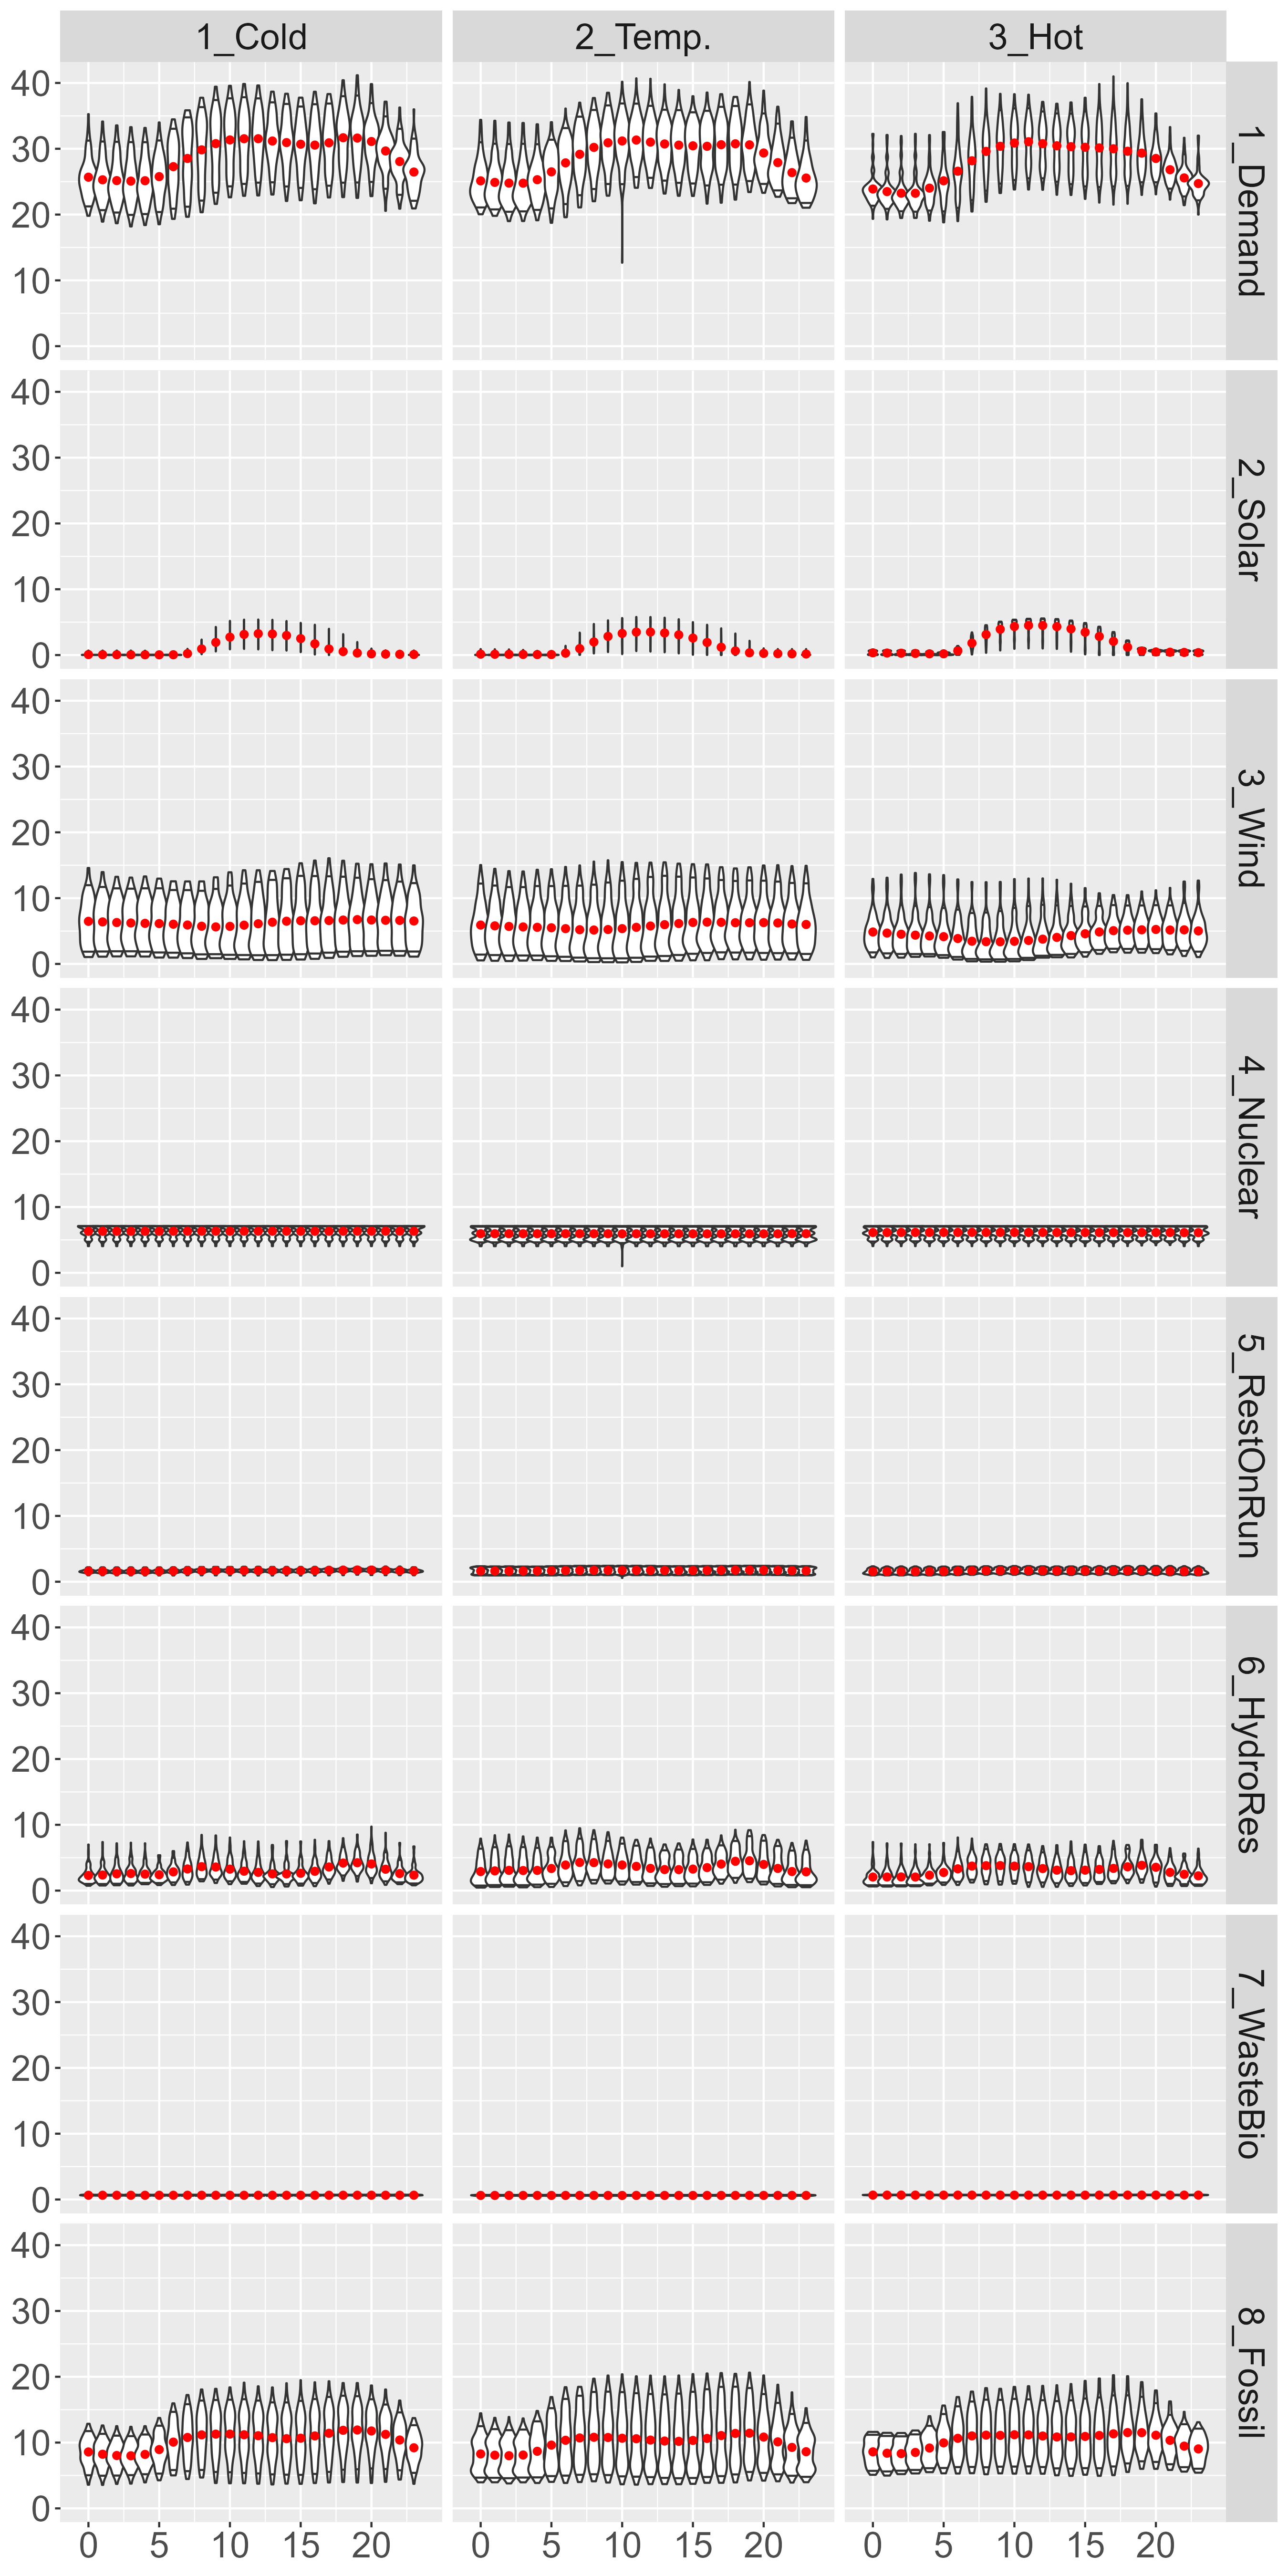
The following is observed:
- Solar energy represents a 4.8% of production, and has a very definite intra-day structure, driven by insolation.
- Wind represents a 19,6% of production and has not a marked intra-day structure, but the length and form of the violins show the uncertainty of this electricity source.
- Nuclear represents a 21.4% of production and delivers an almost fixed amount of supply (no intraday structure, very short violins).
- Other non-manageable supply (vg. Hydro “run of river and poundage”) represent 5.8% of supply
- The Manageable sources (48% of production, 11,5% Hydro, 2,2% Waste and Biomass and 34,6% Fossil) are not commented: they simply accommodate the difference between demand and non-manageable supply.
Counterfactual 2018 Iberian market: consequences of renewable energy expansion
In this section I report the results of an exercise where the percent of renewable energy is increased by up to 24 percent points of total generation by the expansion of either Solar or Wind[4]at the expense of a reduction of Fossil energy.
As a consequence of this expansion, an “Excess Generation” term appears, that is, the excess energy produced when the supply of “non-manageable” energy is bigger than demand. Excess Generation shall be either stored [5]or lost.
In the Graph 2, in the left panel it is shown how the expansion of either Wind or Solar (conserving the hourly structure of production) impacts on the reduction of total electricity from Fossil sources (left panel). The red line describes a “perfect” replacement (possible only with complete storage of the excess generation), and then the difference between that perfect case and that where “Excess generation” is lost is depicted for the Wind and Solar expansions.
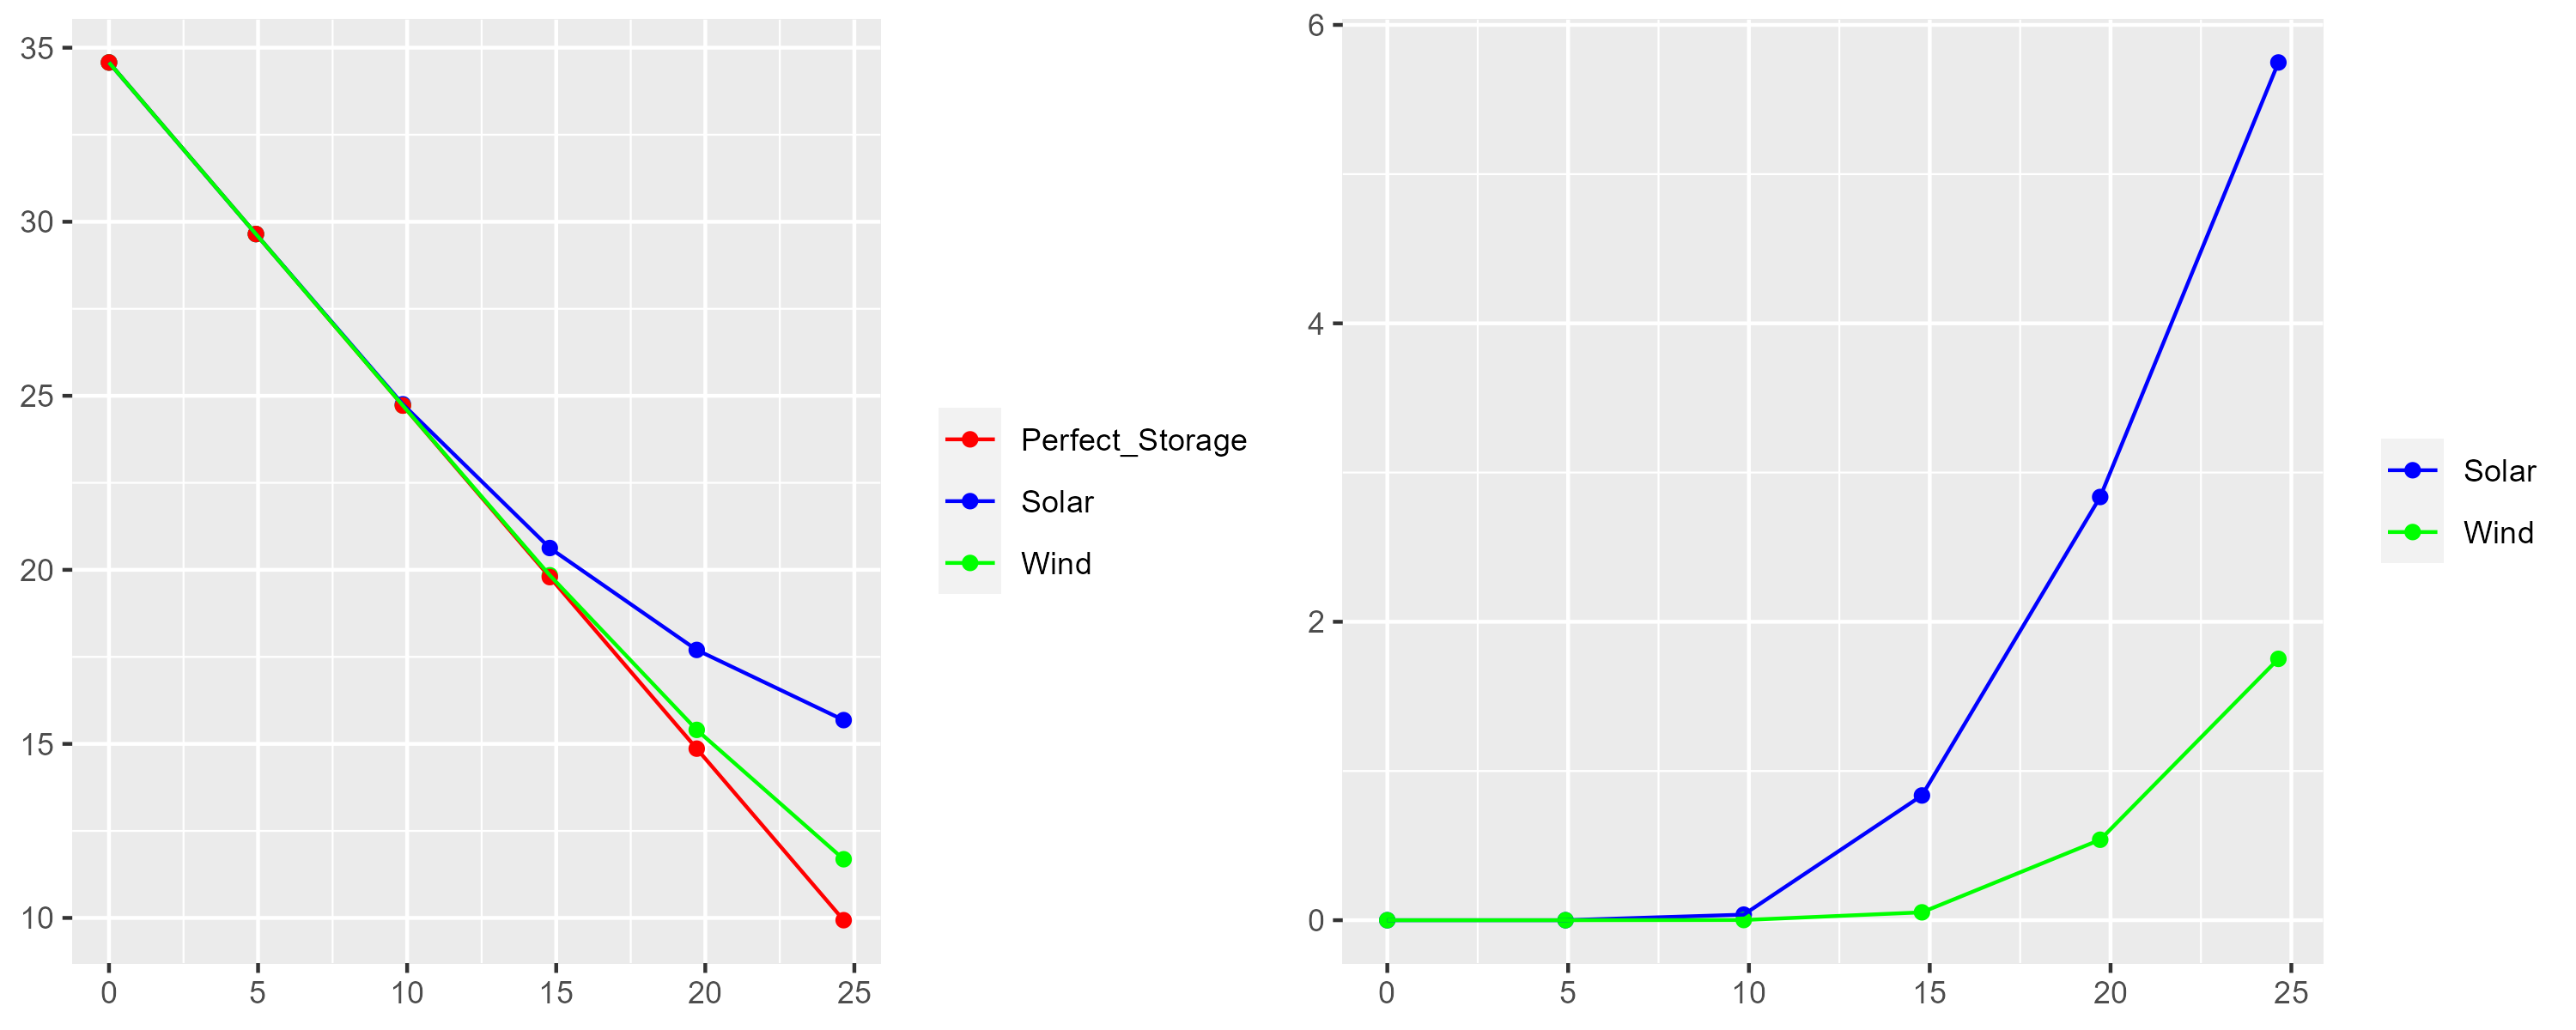
The right panel depicts excess generation: the electricity supply from non–manageable sources in excess of demand, that is, the energy that has is lost or stored. If Wind is expanded by 24 % of current generation[6], that creates excess electricity of around 2%, but the same expansion by Solar would imply more than 6% excess generation.
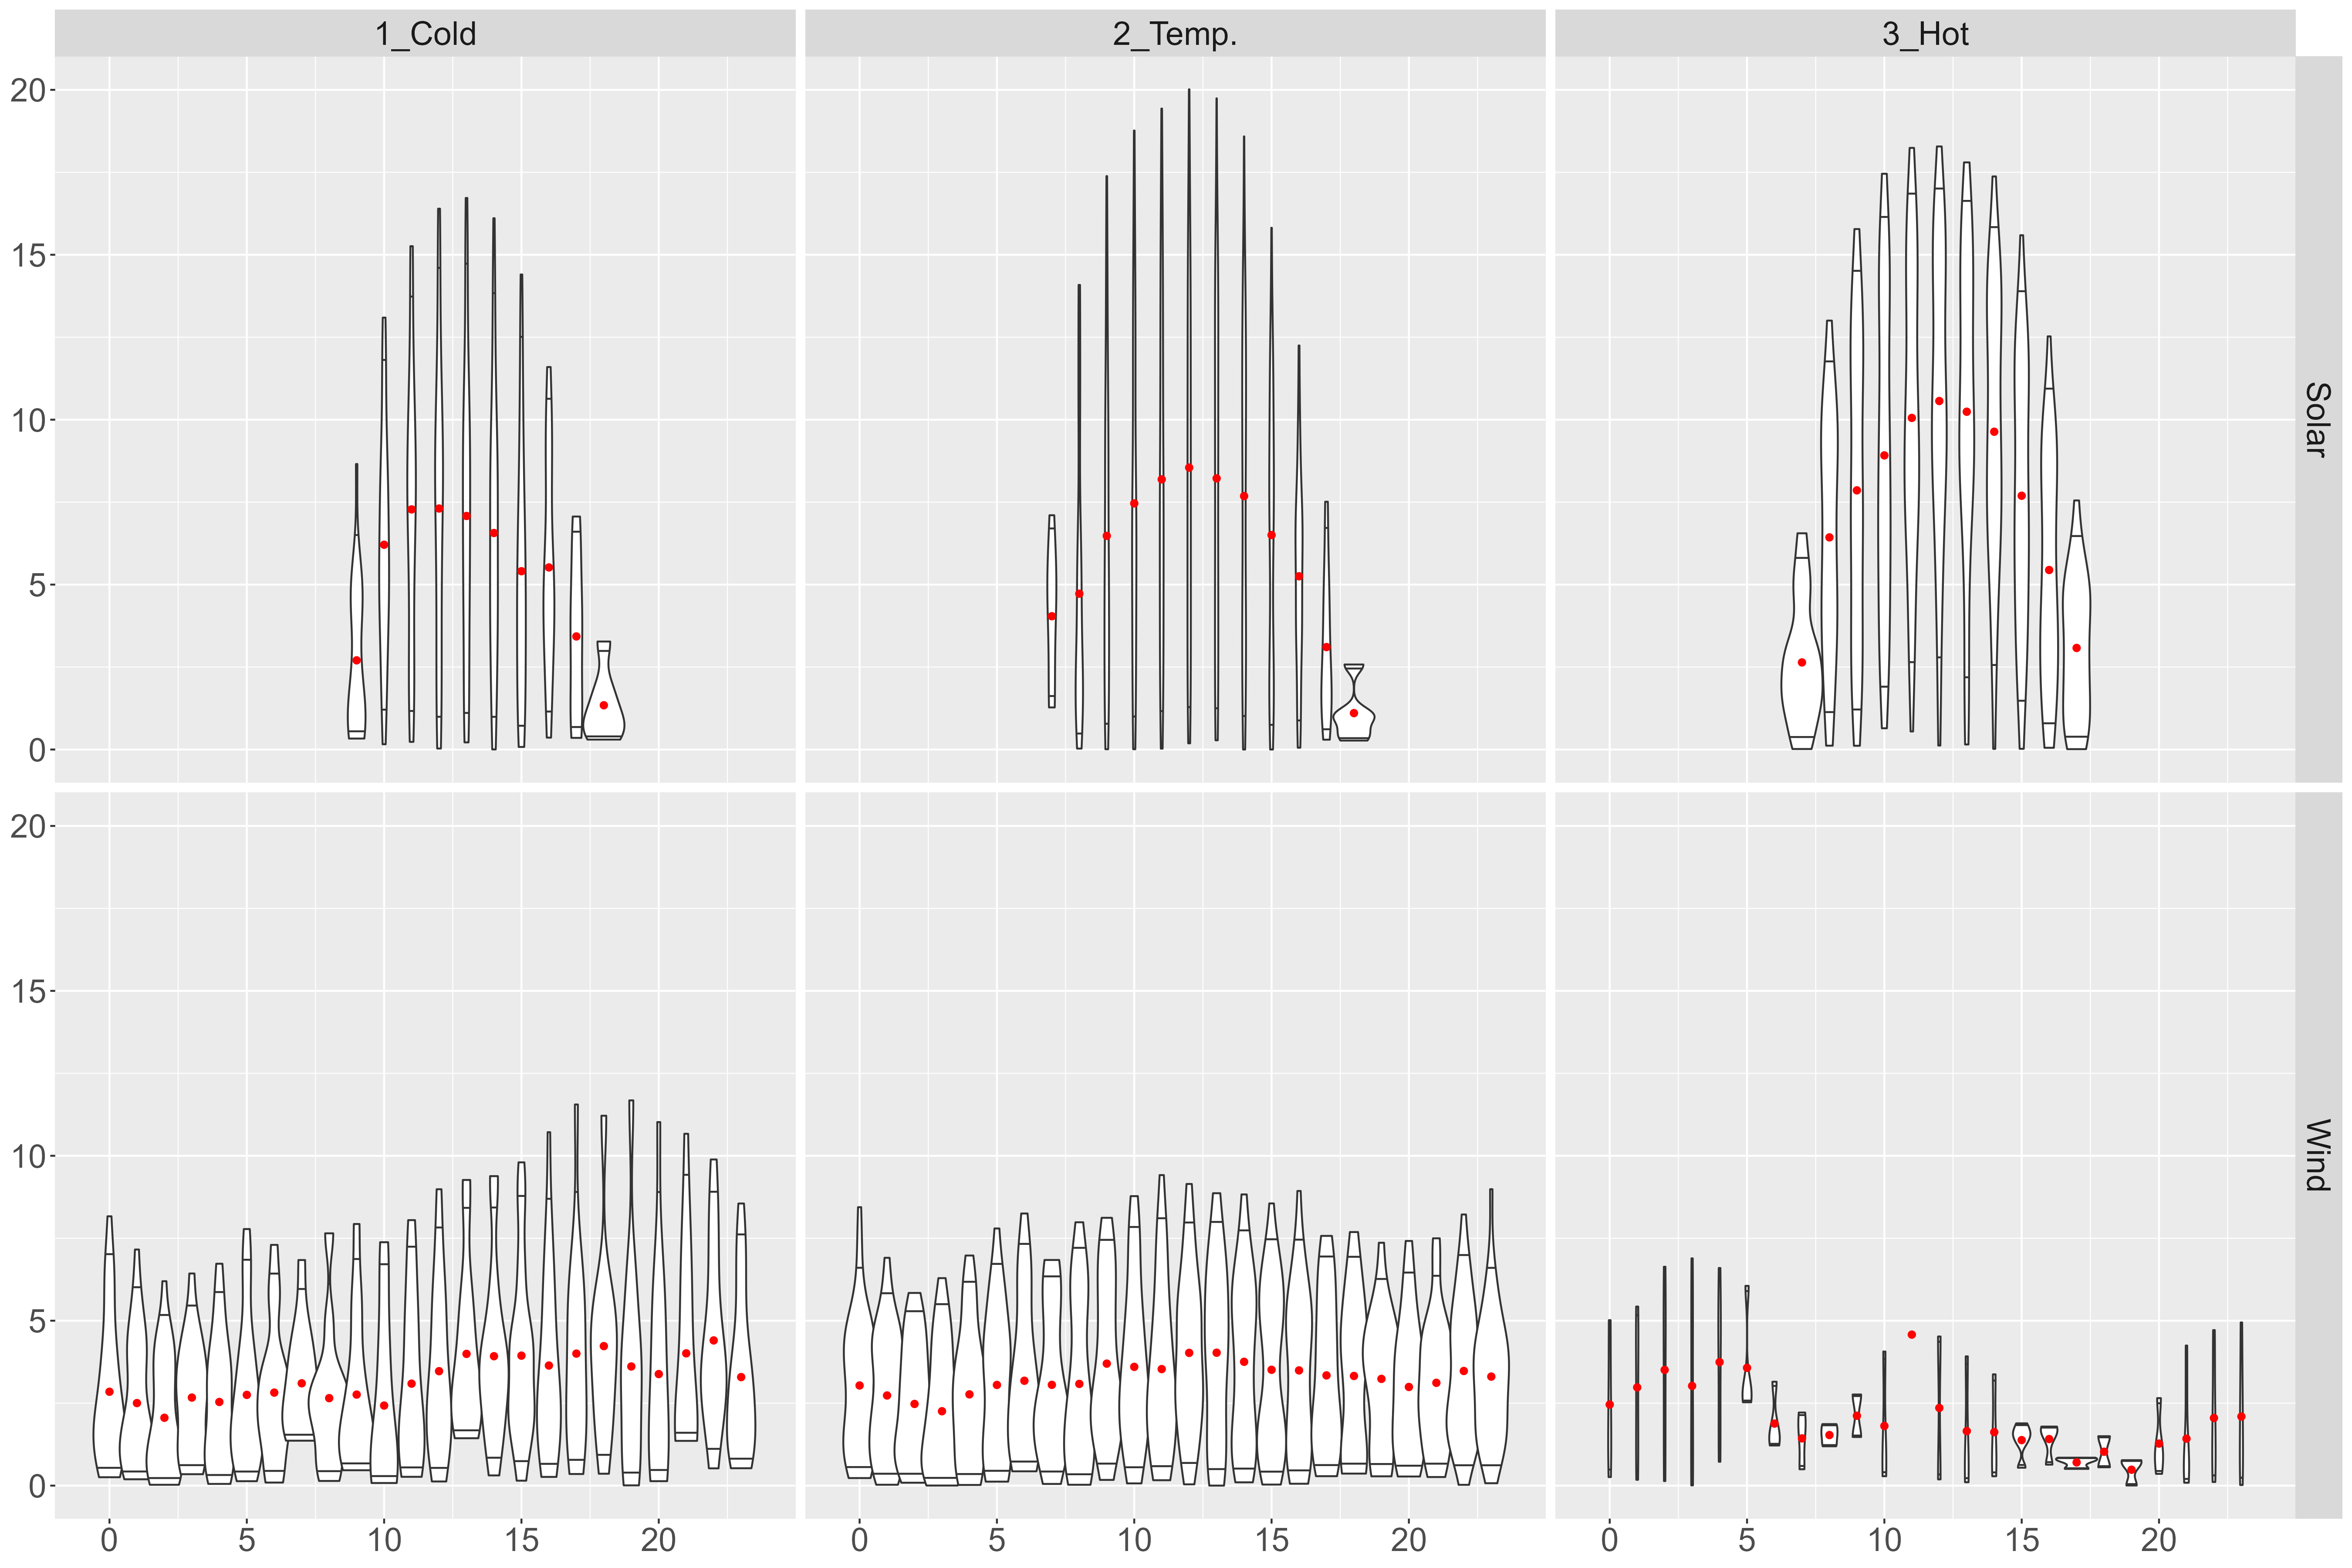
In the following graph “Excess generation” is depicted in a violin graph by season and hour: Wind creates relatively stable (and modest) excess generation, while Solar concentrates the excess generation between 8 and 14 h each day.
Capturing Excess Generation in EV batteries
A natural way to capture this excess generation is by an intelligent charging software that when the car is plugged uses past patterns of driving and time plugged, current battery levels and expected electricity prices to switch on and off the battery charge. Of course, the driver shall always retain the possibility of overriding the intelligent charger (for example, for an immediate trip).
If the increase on renewable electricity supply is driven by Solar, the most useful chargers will be those installed in the parking lots of workplaces (where cars are usually in the middle of the day). Subsidies for recharge points shall have a component awarded in proportion to the amount of “excess generation” electricity that they effectively store.
- ^
In the Iberian market these sources bid at zero by law in the electric power auctions, while of course they are remunerated the final market pool electricity price.
- ^
Geothermal, Marine, Hydro electricity from flowing currents, etc.
- ^
Water in a reservoir has not monetary costs, but the dam operator choses when it is released into the river. As a consequence, dam operators try to deliver in the hours and dates when prices are higher (they are expected to operate on the basis of the “shadow price” of the water).
- ^
Conserving the hourly structure, that is, in the dataset, the Wind and Solar production is expanded while keeping the exact relative hour production.
- ^
Exporting the excess is impossible for a closed electric system [Iberia is an electric quasi-island] and if this excess tends to appear in the trading partners simultaneously, also in an open one.
- ^
This is difficult in Iberia, where the best locations for Wind farms are already developed.
Also posted in EA Forum: https://forum.effectivealtruism.org/posts/jJap6KhzFe3mgh32M/electric-vehicles-and-renewable-electricity