The most important part of historical research is the question. For one, your Python script won’t work if you can’t clearly describe your error as a Google search. But I’m really talking about curiosity. In order to start collecting data, exploring the literature, and formulating an argument, you usually need to start with a problem—a vexing assertion, bizarre lacuna, or obvious question that nags you without end. Once you have that, you can start thinking about how you’ll answer it. What model will you choose for thinking about the problem—and will it be theoretical or empirical? What kinds of and how much data would you ideally need to test your hypothesis or validate your theory? Do these sources exist already, or will you need to collect or create them for yourself? And so on. All of these important choices stem from the critical starting point: the raison d’etre for your research agenda. They put into concrete, formal practice the question that has hitherto remained abstract, and—in the end—should provide a framework to convince you that you’ve answered it.
This four-stage(ish)1 process is exemplified by one of my favorite economic history papers: Peter Temin’s 1997 “Two Views of the British Industrial Revolution.” Temin offers an instructive example about how to take an important, purely historical question—what is the correct description of technical change during the Industrial Revolution?—and write out and test a model with which to answer it. Indeed, “Two Views” is a paean to the powerful insights that simple economic reasoning and clear thinking can bring to the table in researching the past. By 1997, Temin’s style of classical cliometric argumentation was already fading from the forefront of economic history as the discipline began its merger with economics—AJR 2001 was under development—but he explicitly used the framework that I’ve described in a way that applies equally to our sophisticated econometrics two-and-a-half decades on. In this essay, I’m going to run through the paper and let him convince you of that fact.
It’s worth quoting the abstract in full, because it explicitly and parsimoniously lays out the question-design structure described above:
There are two views of the British Industrial Revolution in the literature today. The more traditional description sees the Industrial Revolution as a broad change in the British economy and society. This broad view of the Industrial Revolution has been challenged by Crafts and Harley who see the Industrial Revolution as the result of technical change in only a few industries. This article presents a test of these views using the Ricardian model of international trade with many goods. British trade data are used to implement the test and discriminate between the two views of the Industrial Revolution.
Temin starts with a problem. There are two descriptions of the British Industrial Revolution: the traditional Ashton-Landes tale of a “wave of gadgets” sweeping over England, transforming all aspects of economic life, and the more recent Crafts-Harley growth accounting approach emphasizing the expansion of two modern sectors—cotton and iron—and the stagnation of the rest. He will “test” these views with a many-goods Ricardian model and using British trade goods as the empirical basis for the test. There’s no hint of evasion, equivocation, or (even accidental) obfuscation. If he’d previewed the results, you could stop reading there and be able to describe the paper to anybody.
But let’s keep going. The introduction, which lasts for only five short paragraphs, expands upon these methodological themes. “It may seem as if the choice between these two views is a matter of taste,” writes Temin. “But it is seldom that an empirical question cannot be tested.” The ideal way to discern whether few or many industries experienced productivity growth would, of course, to get direct indexes of inputs and outputs, but those are frequently unavailable. So Temin will use a proxy—trade data—in the context of a Ricardian trade model. Interacting each of the two views with the model generates a distinct hypothesis for what should be observed in the statistics. If Crafts-Harley is correct, then British exports would have been limited to iron bars and cotton textiles; if Ashton-Landes, then Britain would have exported a diverse range of products. One can easily look into the trade figures and observe which result prevails.
Section II describes the debate that Temin wants to settle. The historian T. S. Ashton suggested that the Industrial Revolution was characterized by “innovations of various kinds—in agriculture, transport, manufacture, trade, and finance—that
surged up with a suddenness for which it is difficult to find a parallel at any other time or place.” His perspective was popular in the 1950s and 1960s thanks to the statistical work of Deane and Cole and Landes’s The Unbound Prometheus. But during the 1980s, Nicholas Crafts and C. Knick Harley produced new estimates for British economic growth during the Industrial Revolution that were substantially lower than Deane and Cole’s. Practically all of the downward revision came from a reduction in the contribution of non-modernized sectors, from .55 to .07 and then just .02 percent per year. Temin summarizes: “As Crafts repeated throughout his discussion, the Industrial Revolution in [his] view was a decidedly localized affair. The industries affected were textiles, iron, and transportation. All else-other manufactures and other services-were technologically stagnant for the first half of the nineteenth century.”
But that created a paradox: if British industry was even more backward than its agriculture, why didn’t the country “peripheralize,” exploiting its comparative advantage by exporting food and importing manufactures? Crafts resolved the paradox by arguing that Britain’s true comparative advantage was in cotton and iron specifically, not manufacturing generally. Harley backed this up with a computable general equilibrium model that, when simulated, showed that Britain would indeed export textiles and smelted goods while importing food. Patrick O’Brien summarily consigned the “old-hat” Ashton view to the dustbin, noting dismissively that “[it] is still being read and continues to be written by an unrepentant but elderly generation of Anglo-American economic historians.” In the absence of industry-level data, however, he despaired of convincing the venerable holdouts to give up. The old economic history would have to die with its theorists.
But Temin refuses to let the issue die there. In Section III, he proposes an alternate way to solve the problem. “The implications of the Crafts-Harley view for Britain's international trade can be used to formulate a test of these views,” he says. “A model is needed to derive a test, more formal than Crafts's verbal exposition and more transparent than Harley's computable general equilibrium model.”2 He suggests that the Ricardian model of international trade with many goods—developed in a classic paper by Dornbusch, Fischer, and Samuelson (1977)—will do the trick. Unlike Harley, Temin undertakes to explain exactly how the model works, and since that’s the beauty of this paper, I’ll try to follow along, letting him do some of the exposition and interjecting when the going gets tough. It’s a simple model pulled straight out of an undergraduate textbook, but since some readers will not be familiar with it, I think a gradual explanation will be helpful.
To start: “Imagine two ‘countries’: Britain and everywhere else.” Each ‘country’ uses a single factor of production, labor. Labor is “Hicksian,” in that its price does not change relative to other factors, so land and capital can be ignored for the sake of simplicity. “Each country both produces and consumes a large variety of goods made from this single factor of production. These goods can be numbered from 1 to N. The technology of each country can be described by the labor needed to produce each good.”
To produce good n at home requires a_n hours of British labor, and a*_n hours in the “rest of the world.” The lower is a_n, the higher is the country’s productivity in producing good n, because it takes less time (and thus input) to create a unit of output. The ratio between the two countries’ productivities in making n is a*_n/a_n; the higher the ratio, the wider Britain’s absolute advantage. You can then order all N goods from highest to lowest, with the left side being the goods in which Britain’s advantage is greatest and the right side being where it is least.

Whether Britain or the rest of the world exports a good depends on the relative cost of producing it in each country. In the Ricardian model, the only cost is that of labor—the wage. If w is the British wage and w* the foreign wage, then the cost of producing a unit of good n in Britain is (a_n)(w): the time needed for the worker to produce one n (say, a bolt of cloth) multiplied by the prevailing hourly or weekly wage. It similarly costs (a*_n)(w*) to produce n abroad. It stands to reason that Britain will produce any good for which (a_n)(w) < (a*_n)(w*), and vice versa—it’s cheapest that way. If you divide both sides by a_n and w*, you get the following:

The implication: Britain produces any good for which the above inequality holds true. Stated in plain English, Britain will make any good in which its relative productivity advantage is greater than its relative labor costs. You can go back to the “continuum” of a*/a productivities and place w/w* as a divider: Britain exports all the goods on the left to the rest of the world, and imports the goods on the right.
How are wages set? Temin: “The wage in each country is determined by the demand for labor, which is determined in turn by the range of goods produced in that country. If the range of domestic goods increases at any relative wage, then the demand for domestic labor rises.” Thus there’s a positive relationship between the number of products produced and the relative wage rate. Temin provides a useful graph on page 70:
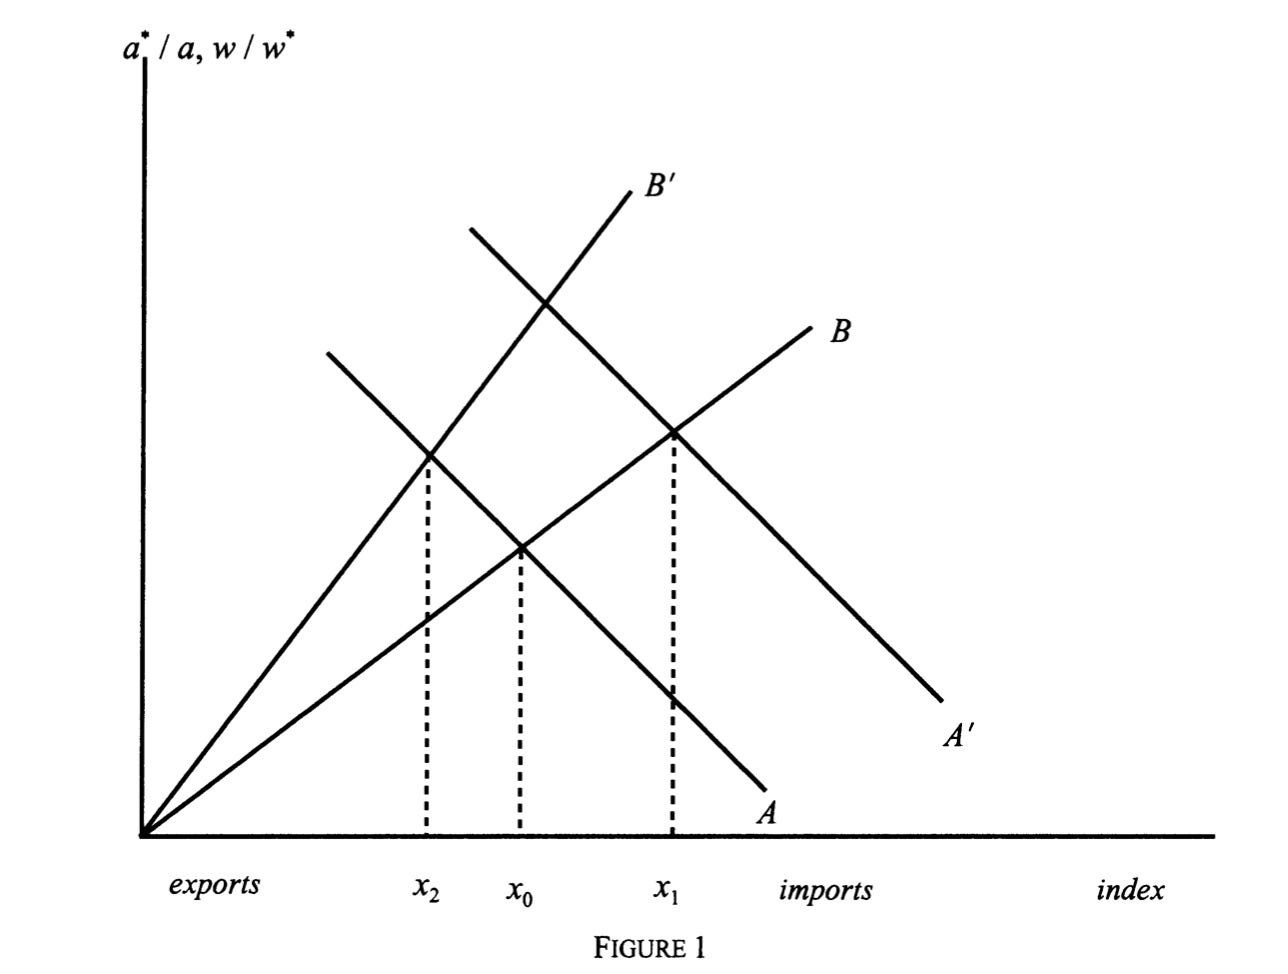
The X axis represents the list of goods exported (everything to the left of x0) and imported (to the right), and the Y axis both the relative wage rates and productivities. Line A is the just the continuum of a*/a terms that we highlighted above. Line B is the relationship between the relative wage rate and the fraction of goods exported. The equilibrium number of goods produced is where the lines cross—in other words, exactly where the divider w/w* sits in the continuum of goods.
Now you can easily generate the hypotheses for the Ashton-Landes and Crafts-Harley views. Technological progress in Britain means that the time needed to produce a good falls; according to the “traditional” view, this happens for all or most industries. Since a falls while a* remains static, Line A shifts out to A’. Crucially, the number of goods exported increases from x0 to x1. If Ashton is right, Britain would have exported a wider variety of goods during the Industrial Revolution.
But if technological progress is restricted to a few sectors, the result is entirely different. If Britain already exports the good, then wages will rise and Line B will shift up to B’. The number of goods produced by Britain will fall from x0 to x2. If Crafts and Harley are right, Britain would have exported a narrower variety of manufactures during the Industrial Revolution. Temin’s summary is perfect: “The Ricardian model consequently generates a simple test to discriminate between the two views of the British Industrial Revolution. Were other manufactures exported or imported? If exported, then the view change was widespread among British industries in the early nineteenth century is confirmed. But if the other manufactures were imported, then the conclusion that technical change was restricted to a very few modem industries while other industries stayed mired in premodern production techniques is confirmed.”
We’ve asked our question, set up a model, and produced hypotheses. All that remains is to collect data and run the test. Temin’s source is the set of trade figures compiled by Ralph Davis in his 1979 book The Industrial Revolution and British Overseas Trade. He demonstrates that Britain exported an enormous variety of manufactured goods as late as 1850, when the accumulated productivity gains of cotton and iron over the laggard sectors should have been greatest. Linens amounted to £4.7 million, silks to £1.2 million, and miscellaneous metal-worked goods—hardware and cutlery, brass and copper, tin and pewter ware—to more than £5 million. But variety is what counts, and Britain had it in spades: beer and ale, weapons, glass, soap, books, candles, hats, instruments, parasols, hats, drugs, stationery, jewelry, watches, and painters’ colors (to name just a few categories) all found foreign markets. Imports, by contrast, consisted—with the exception of silks, a few cotton and wool articles, and watches and clocks—almost wholly of foodstuffs and raw materials: £23.7 million worth of cotton, £10.7 million of sugar, £9 million of corn, meal, and flour, and similarly vast quantities of coffee and tea. “None of the myriad other British manufacturing exports were imported at all.”
Temin’s conclusion, therefore, is that “the traditional ‘old-hat’ view of the Industrial Revolution is more accurate than the new, restricted image. Other British manufactures were not inefficient and stagnant, or at least, they were not all so backward.” Furthermore, the Crafts-Harley estimates of productivity growth in the non-modernized sectors were clearly too low, and would have to be revised. Seventeen pages of brevity and clarity were all that he needed for this exercise—an efficiency befitting a great economist. Is Temin completely correct? Probably not; Crafts and Harley replied with a new set of simulations three years later that showed that demand for food imports could boost manufactured exports even in the absence of widespread productivity growth. But there are always limits to modes of argumentation—that’s beside the point. What Temin shows, and does better than Crafts and Harley, is the power of formal economic reasoning to generate testable hypotheses about the past. As our own papers flirt with the hundred-page mark, we can clearly learn something from his example.
This is a fantastic write-up, and I would like to see more like it.
I always enjoy seeing love lavished on important intermediate artifacts, like a particular paper, or particular tool, or particular storytelling technique. For papers in particular I would love to see piles and piles more highlights, walkthroughs, and appreciation of great papers across all fields.