Notes: In the final piece, I will include slightly redesigned figures to make them a bit easier to read. I appreciate any feedback, and particularly on the general lessons we can glean about progress from this story.
The first thing I do each morning is check the weather forecast. As a morning runner in Québec, Canada, I can be in for the full spectrum of conditions: rain, blizzards, ice, darkness, sunshine, wind, and anything between 25 and -35 degrees Celsius (77 to -31 degrees Fahrenheit). And to top it off, 2023 seems to have been the year of poor air quality due to rampant wildfires north of where I live, leading me to follow the weather more closely.
Missing a few runs isn’t fun, but the stakes are much higher for others. Just this year, we’ve seen wildfires from all over Canada that look poised to impact the economy, weather disasters in the US totaling over $57 billion in damages, and a bunch of extreme heat events all over the world which pose a danger to residents in those areas. Being able to know when the conditions are ripe for fires or when major storms are on the horizon literally saves lives. For people in agriculture, having an idea of future conditions enables them to plan ahead. For the aviation industry, weather forecasts make flights safer.
Today, our weather prediction infrastructure[1] sprawls across the land, sea, and skies of Earth, and even extends into space. It collects hordes of data each day, and our massive computing power turns that data into information about our future, increasing our resilience as a species. But it wasn't always this way.
On August 25, 1873, a hurricane hit the coast of Cape Breton Island in Nova Scotia, Canada, surprising residents and killing somewhere between hundreds and a thousand, while also destroying ships and homes. The tragic part was that this hurricane had been climbing the US East coast, so Washington, DC had warned Toronto about the hurricane a day before. However, Toronto wasn’t able to pass the message to Nova Scotia because the telegraph lines were down. The result: A surprise disaster and not enough time for preparation. What would have happened if Canada had a better early warning system? What if they had their own forecasting system, so the telegraph lines wouldn’t have been a bottleneck?
It’s difficult for me to imagine not having easy access to weather forecasts, but this used to be everyone’s reality. My daily practice and the onslaught of weather- and climate-related news made me wonder: How did we set up the global system of weather forecasting that we have today?
(Note: I’ve drawn extensively from Peter Lynch’s book, The Emergence of Numerical Weather Prediction: Richardson’s Dream for analysis and quotes from Richardson’s book.)
Casting the weather as a physics problem
During the nineteenth century, we had very little of our current system. While people were beginning to make observations, the American meteorologist Cleveland Abbe wrote in 1901 that the predictions “merely represent the direct teachings of experience; they are generalizations based upon observations but into which physical theories have as yet entered in only a superficial manner if at all.” (Emphasis mine.)
Despite being at the beginning of what would become the “quiet revolution” of numerical weather prediction, Abbe still saw huge potential for meteorology:
“But the latter [meteorologists] are slowly building a grand structure, mathematical, graphical, and numerical, in which deductive reasoning will take the place of empirical rules. The whole will eventually form a complex intellectual machine, by means of which the general, and possibly the detailed phenomena of the atmosphere, will be followed up day by day.”
Clearly, Abbe was right. Yet he wasn’t the only one thinking about the atmosphere as a physical system that we could model and project into the future. In 1904, the Norwegian scientist Vilhelm Bjerknes described the first two steps of the forecasting pipeline: data collection and modeling the atmosphere mathematically.
This kicked off theoretical work from several scientists (including Bjerknes) on laying a mathematical foundation for numerical weather prediction. A crucial contribution came from Lewis Fry Richardson, a scientist who was a newcomer to meteorology in 1911 and wrote a landmark book over the next decade on predicting the weather from initial conditions.
His book is famous for two reasons. First, he used the tools he built in his past scientific work to go further than others at the time: he explicitly wrote down a sort of “cookbook” for weather prediction[2]. Today, the equivalent would be finding a GitHub repository containing code for your specific problem. Second, Richardson demonstrated his procedure by calculating an example forecast from past data[3] for May 20, 1910. This was a huge feat of calculation[4] by hand, which he described[5] as taking[6] “the best part of six weeks to draw up the computing forms and to work out the new distribution in two vertical columns for the first time.”
Unfortunately, there were two major problems: his example forecast was way off, and it took far too much work to carry out Richardson’s procedure. The former problem turned out to be technical issues that others were later able to diagnose and fix. In fact, Lynch later carried out Richardson’s example forecast using a computer and these technical fixes to show that the results become realistic[7].
The latter problem was worse. To his credit, Richardson didn’t shy away from the current impracticality of his method. He offered his “fantasy”, which involved a giant hall with about 64 000 (!) people working together in parallel to carry out his scheme across all the regions of the world. A “conductor” would stand at the centre, managing the entire computation and directing people to slow down or speed up. I encourage you to read the whole fantasy (see the previous link), but here’s the painter Stephen Conlin’s rendition:
(Image. Obtained permission from Stephen Conlin, so I’ll include it in the published version)
In hindsight, this seems quite prescient for the computer revolution. However, these two problems were big enough that Lynch writes[8] that, “Richardson’s work was not taken seriously and his book failed to have any significant impact on the practice of meteorology during the decades following its publication.”
This suggests to me a lesson of progress: A good scientific idea can fail to gain traction because of insufficient resources to take it from theory to practical application. Richardson made huge progress in weather forecasting, but that progress remained latent because of his terrible forecast and the huge workload it took to use his scheme.
His work would eventually have an impact but first, we needed progress in other areas.
Turning weather data collection into automated infrastructure
Around the time that Abbe, Bjerknes, and Richardson were working on the theoretical aspects of meteorology, there was still the problem of getting detailed observations of the atmosphere across many regions. Bjerknes noted that they were far from Abbe’s “complex intellectual machine”:
“This task has not been solved to the extent necessary for rational weather prediction. Two gaps are particularly critical. Firstly, only land-based stations participate in the daily weather service. There are still no observations made at sea for the purpose of daily weather analysis, although the sea accounts for four fifths of the Earth’s surface and therefore must exert a dominant influence. Secondly, the observations of the regular weather service are made at ground level only, and all data about the state of higher layers of the atmosphere are missing.”
To give you a sense of how the quantity of observations changed over time, look at the number of land-based station over time[9] from the Copernicus Climate Change Service:
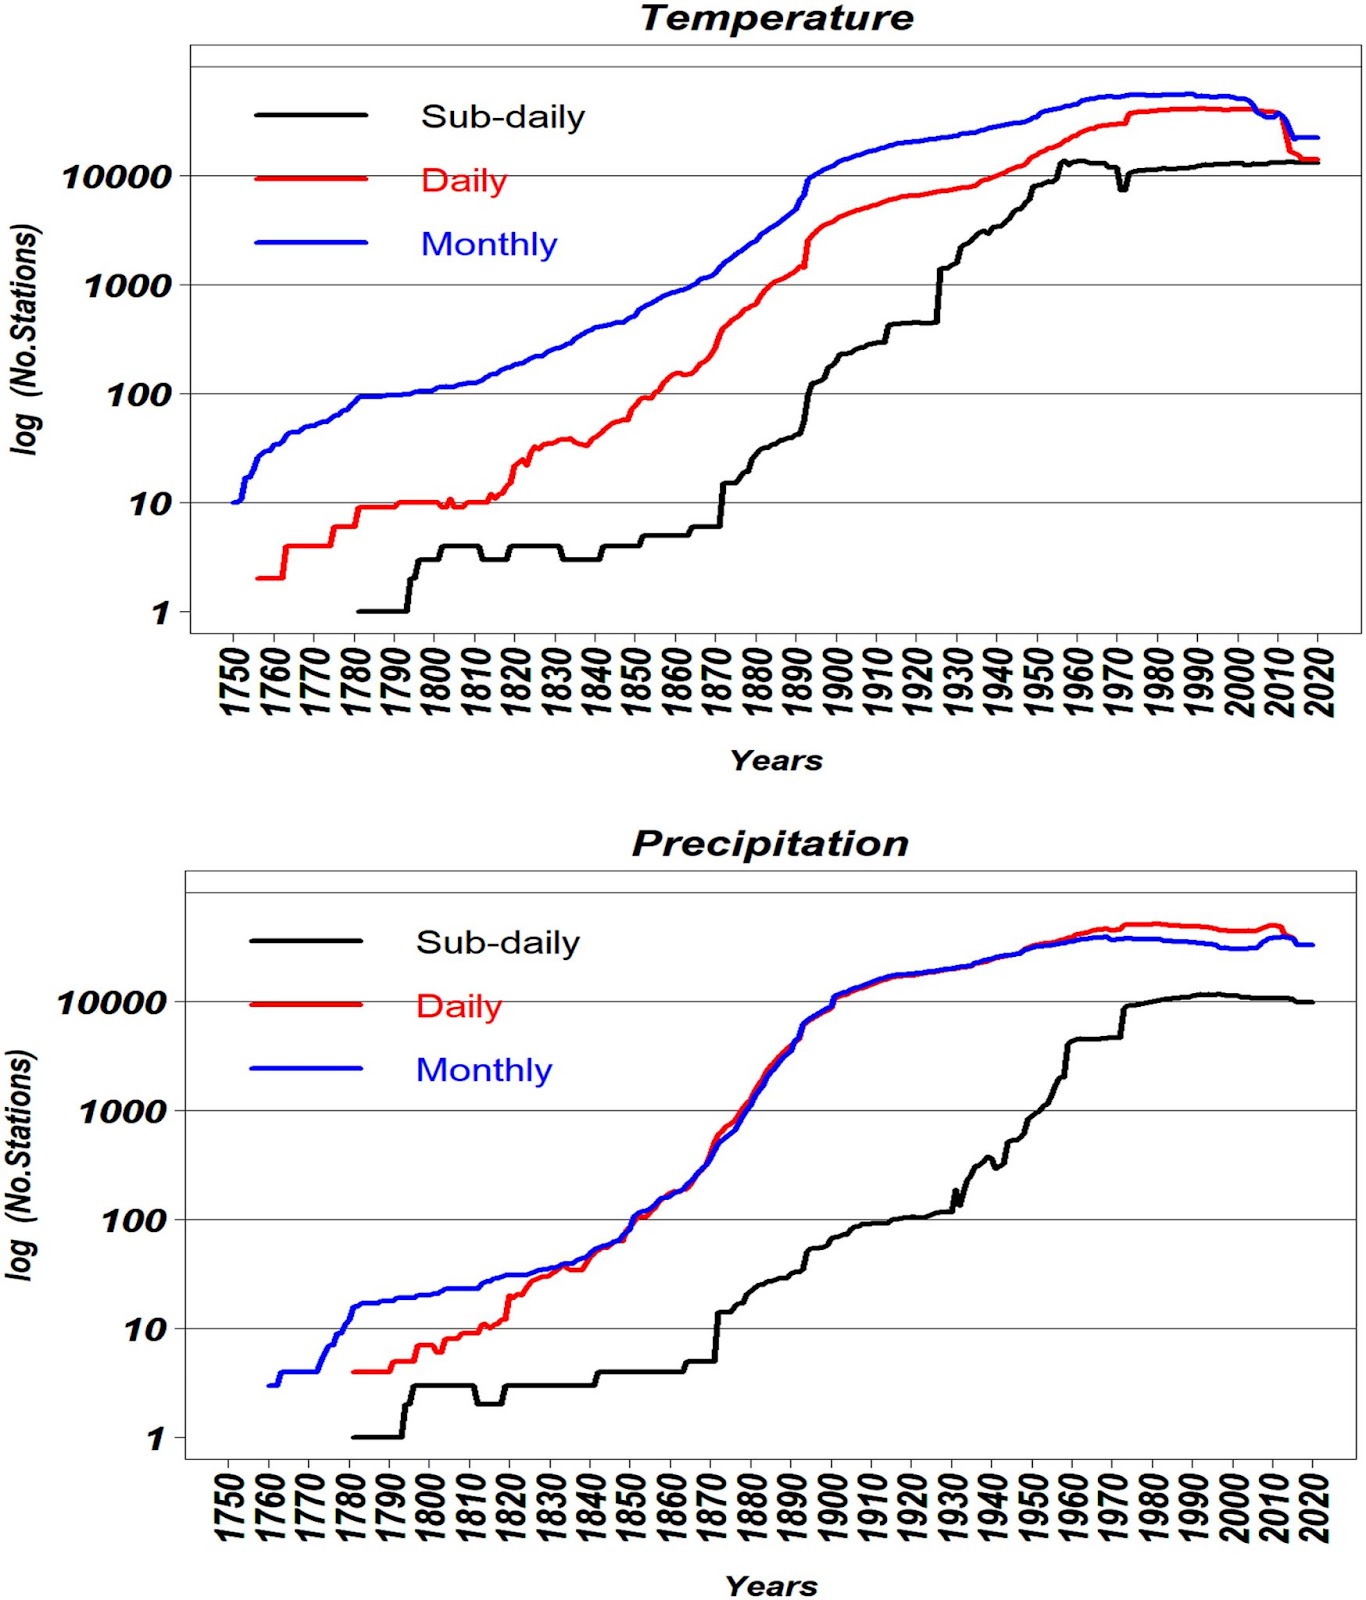
The vertical axis is logarithmic in the number of stations, and the three different curves have to do with how frequently a station collects data (sub-daily often means hourly). You can see that at the time Bjerknes was writing (~1910), there was still a lot of improvement left. Remember, because the vertical axis is logarithmic, a small vertical shift signifies an exponential increase in the number of stations. In other words: Humans added a lot of stations in the twentieth century.
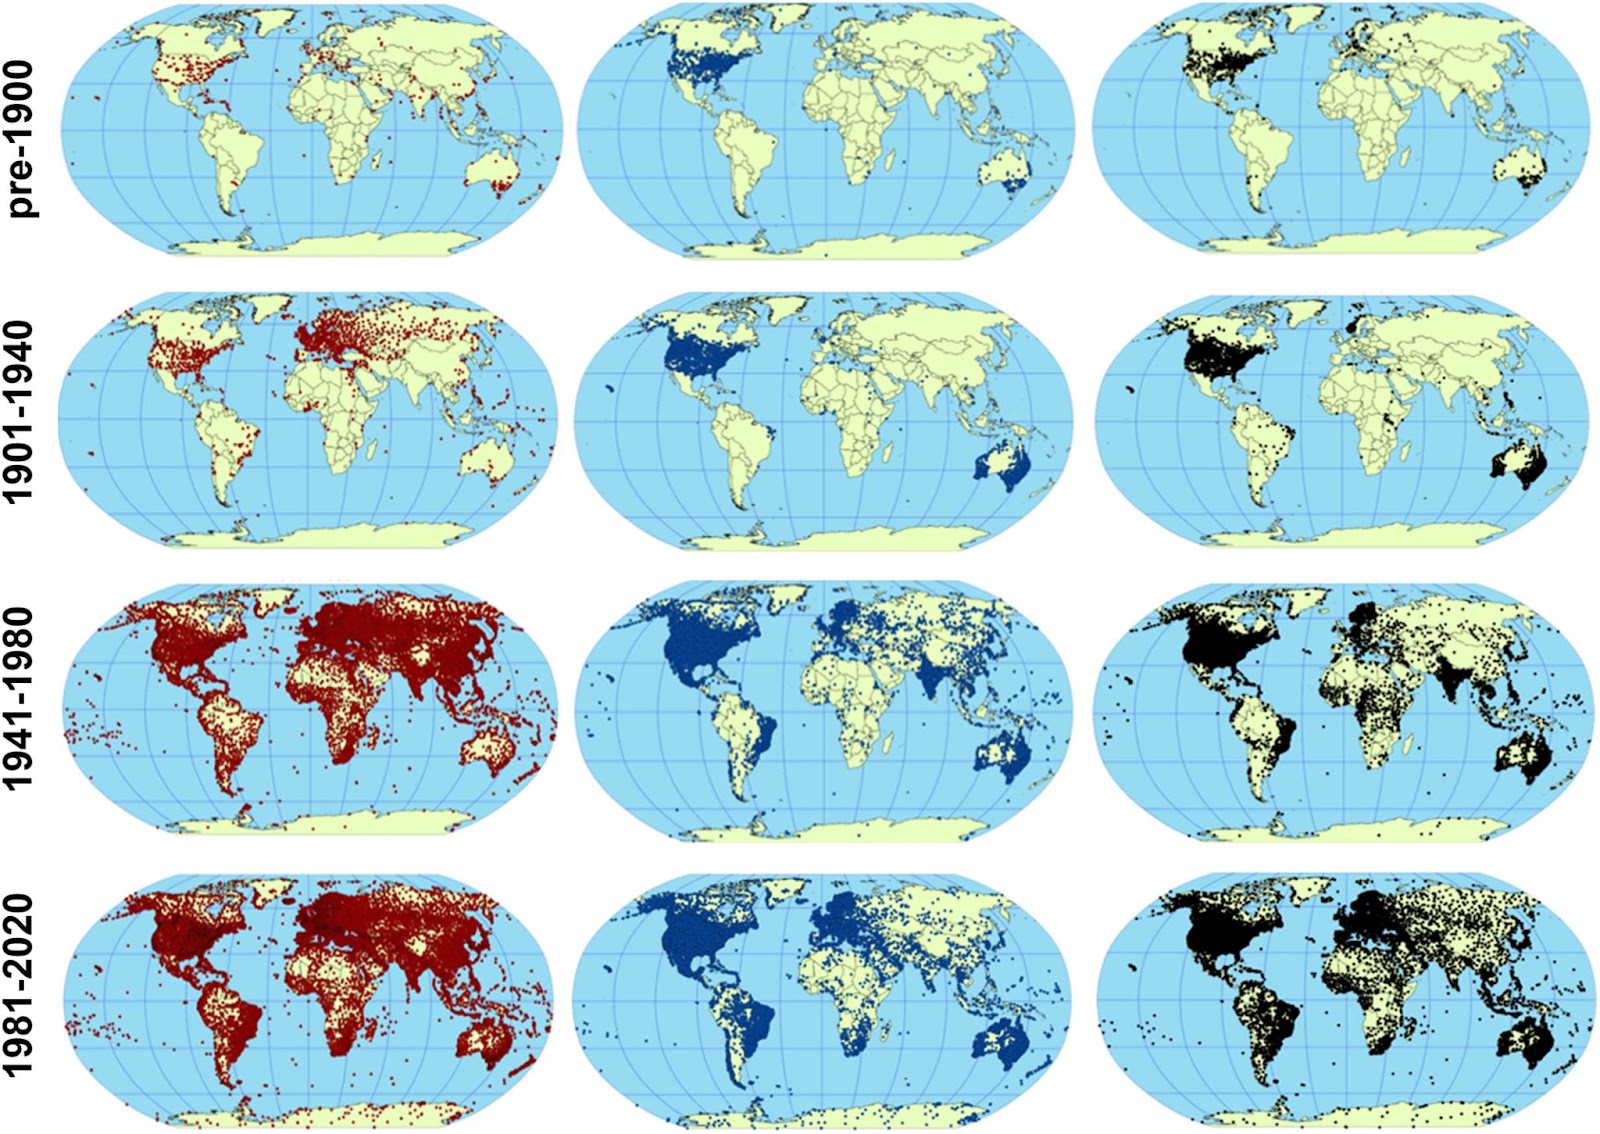
If you prefer a map-based view, here are how the stations were geographically spread out over time[10]:
Bjerknes also mentioned the importance of sea-based observations. Using ships, buoys, and other platforms, we’ve increased those a ton over time as well[11].
It’s one thing to get observations on land or on the sea, but it’s quite another to collect data in the air. In the 19th century, people would travel in balloons and take the measurements themselves. Apart from the danger, this wasn’t exactly a way to set up a system of frequent observations that meteorologists could immediately use in their model.
During the next few decades, people invented better balloons and cheap instruments that recorded on their own[12]. This removed the danger of going yourself with the tradeoff of having to find the weather balloon once it landed.
Still, you only got the data once you found the balloon. There was a delay, which reduced the time meteorologists had to make their forecast using the data. What would be even better is if the instrument could transmit the data directly to the ground.
That’s what meteorologists began using around 1930. The basic setup was essentially a radiosonde (a recording instrument) attached to a parachute, which was attached to a balloon. The radiosonde would transmit back to a station during the balloon's ascent. As the balloon gained altitude, it would expand and eventually pop. Then, the parachute would deploy, hopefully salvaging the device.
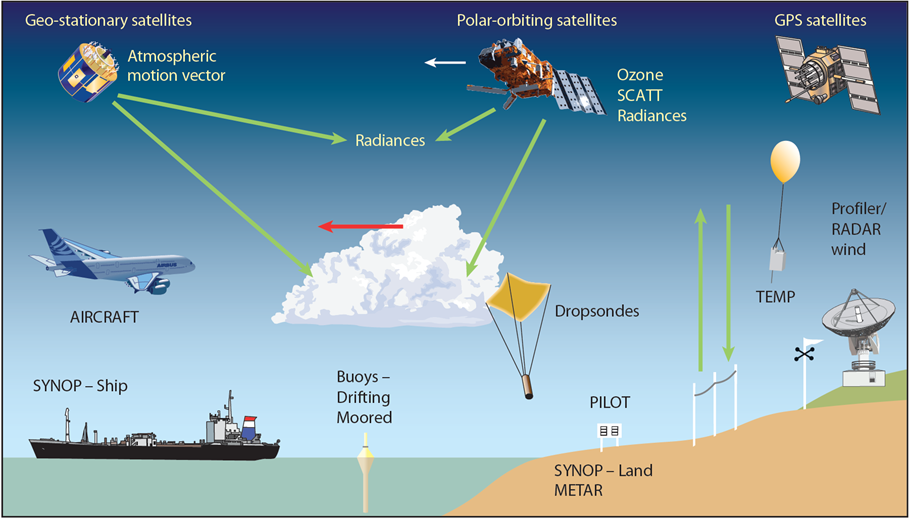
More ways of collecting weather observations came online: airplanes, radar, ships, and eventually space satellites. These now form our global system[13]. Consider the operations of the European Centre for Medium-Range Weather Forecasts (ECMWF). Their current system collects about 800 million data points each day and looks like this:
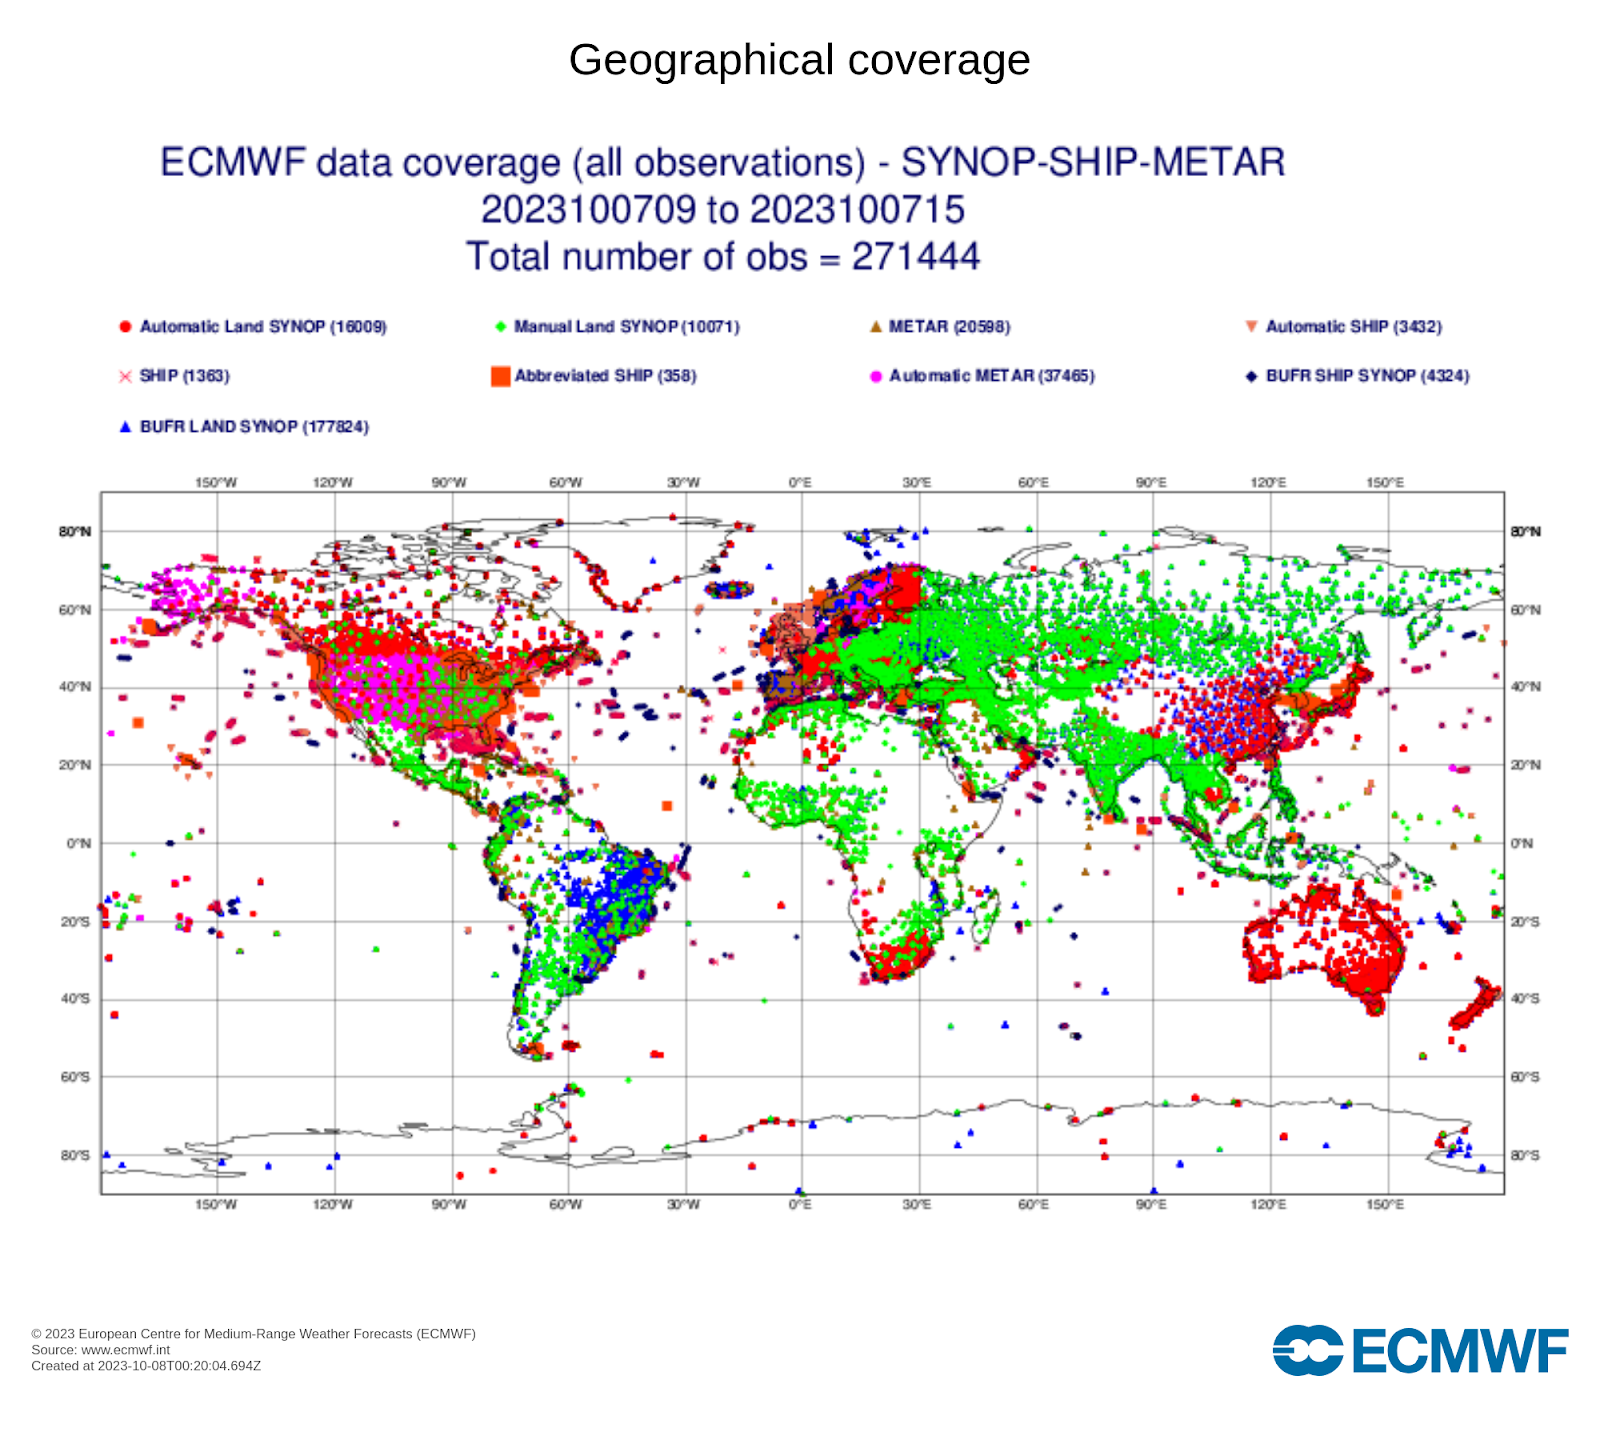
And if I look at the land and ship coverage for October 6, 2023, I find:
To ingest all that data though, we needed computers.
Unlocking operational forecasting with computers
Computational capacity was the other piece of the puzzle missing from Richardson’s fantasy. Progress on that front began in the 1940s, with John von Neumann launching the “Electronic Computer Project” at the Institute for Advanced Studies. Out of the four groups, one of them was “Meteorological”[14].
The meteorologist Jule Charney headed the latter half of the project, and by 1950 the group published their algorithm and the results of their computation. They found that the forecast was of reasonable quality, though as they write, “It may be of interest to remark that the computation time for a 24-hour forecast was about 24 hours, that is, we were just able to keep pace with the weather.” Contrast that with Richardson’s years of computation. Certainly not a useful, or “operational”, forecast, but a promising start.
It didn’t take long to make more progress. The first operational computer forecast occurred in 1954 in Sweden. Others followed suit. In 1975, the ECMWF was founded, and over the coming decades became a world leader in weather forecasts.
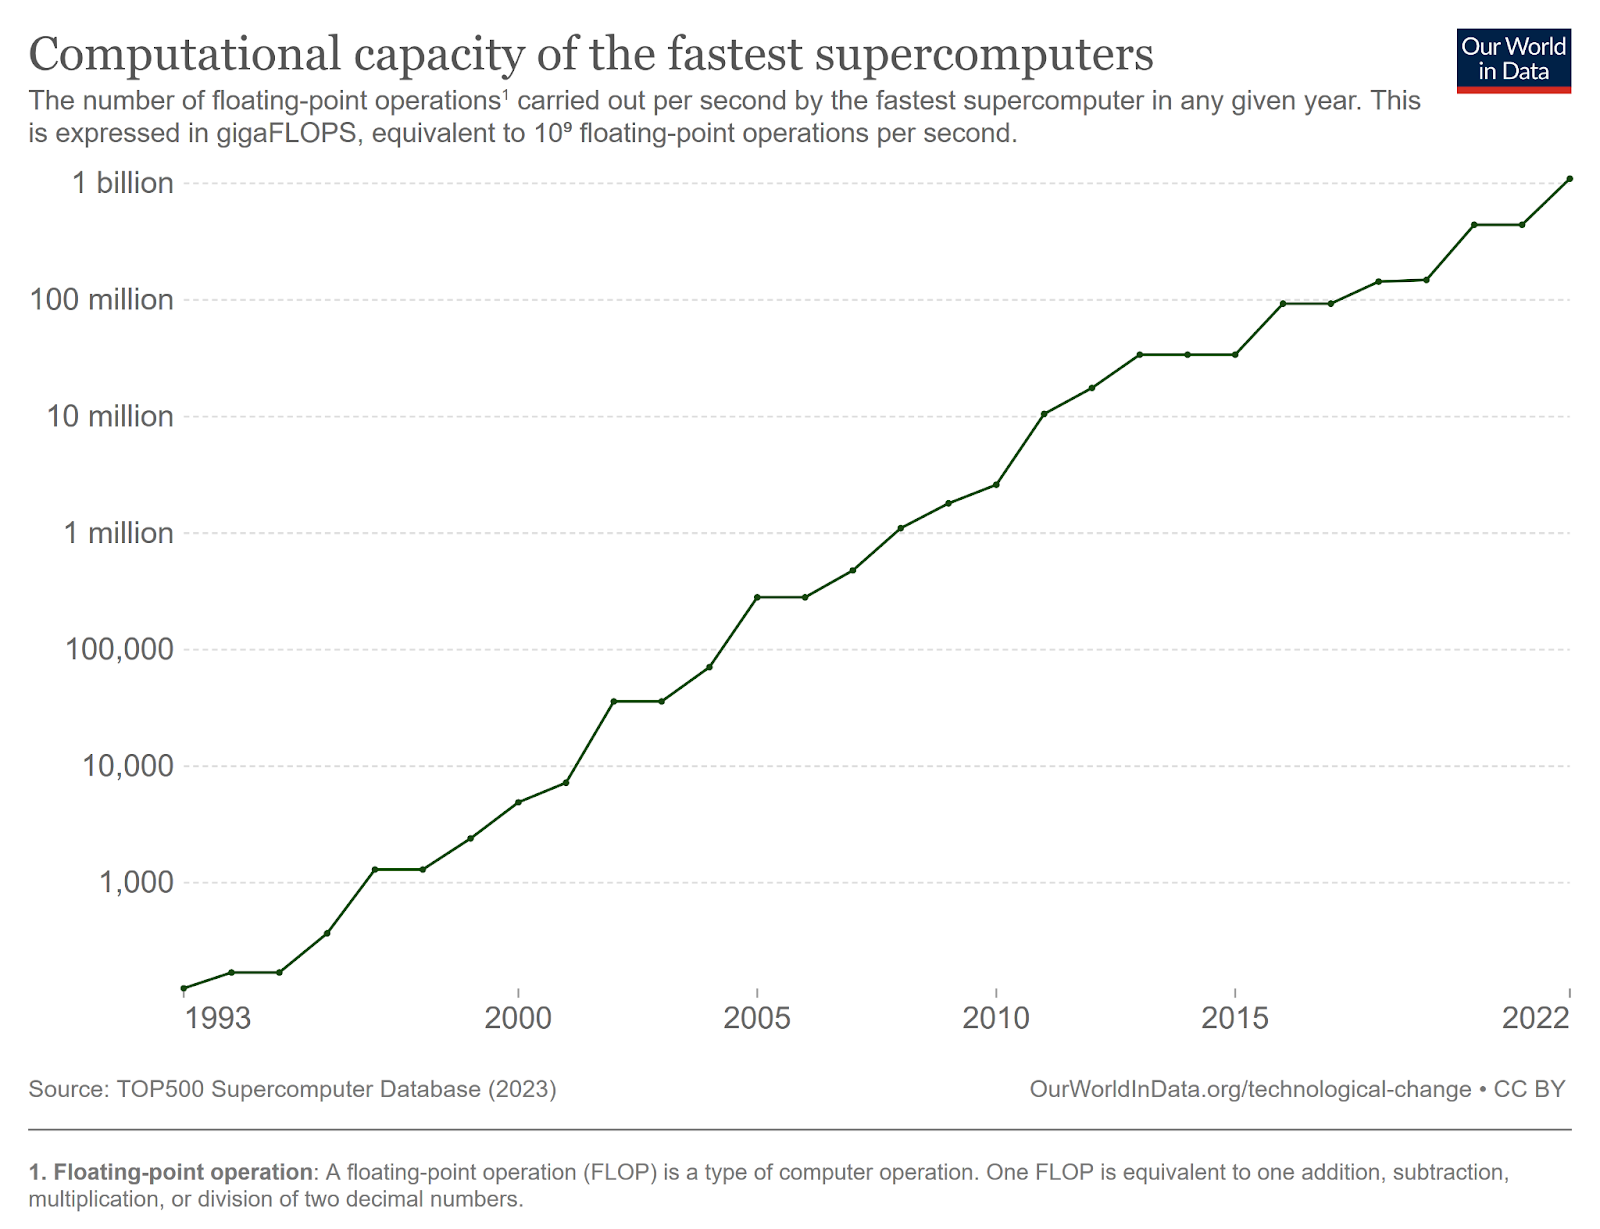
The extra computational power let us not only realize Richardson’s fantasy, but also increase the resolution of our forecasts, incorporate more observations, and improve our models, eventually increasing our ability to predict into the future.[15] You probably know that supercomputing capacity has increased exponentially over time for the last few decades (note the logarithmic scale):
These gains helped ECMWF’s ability to predict the weather further out:
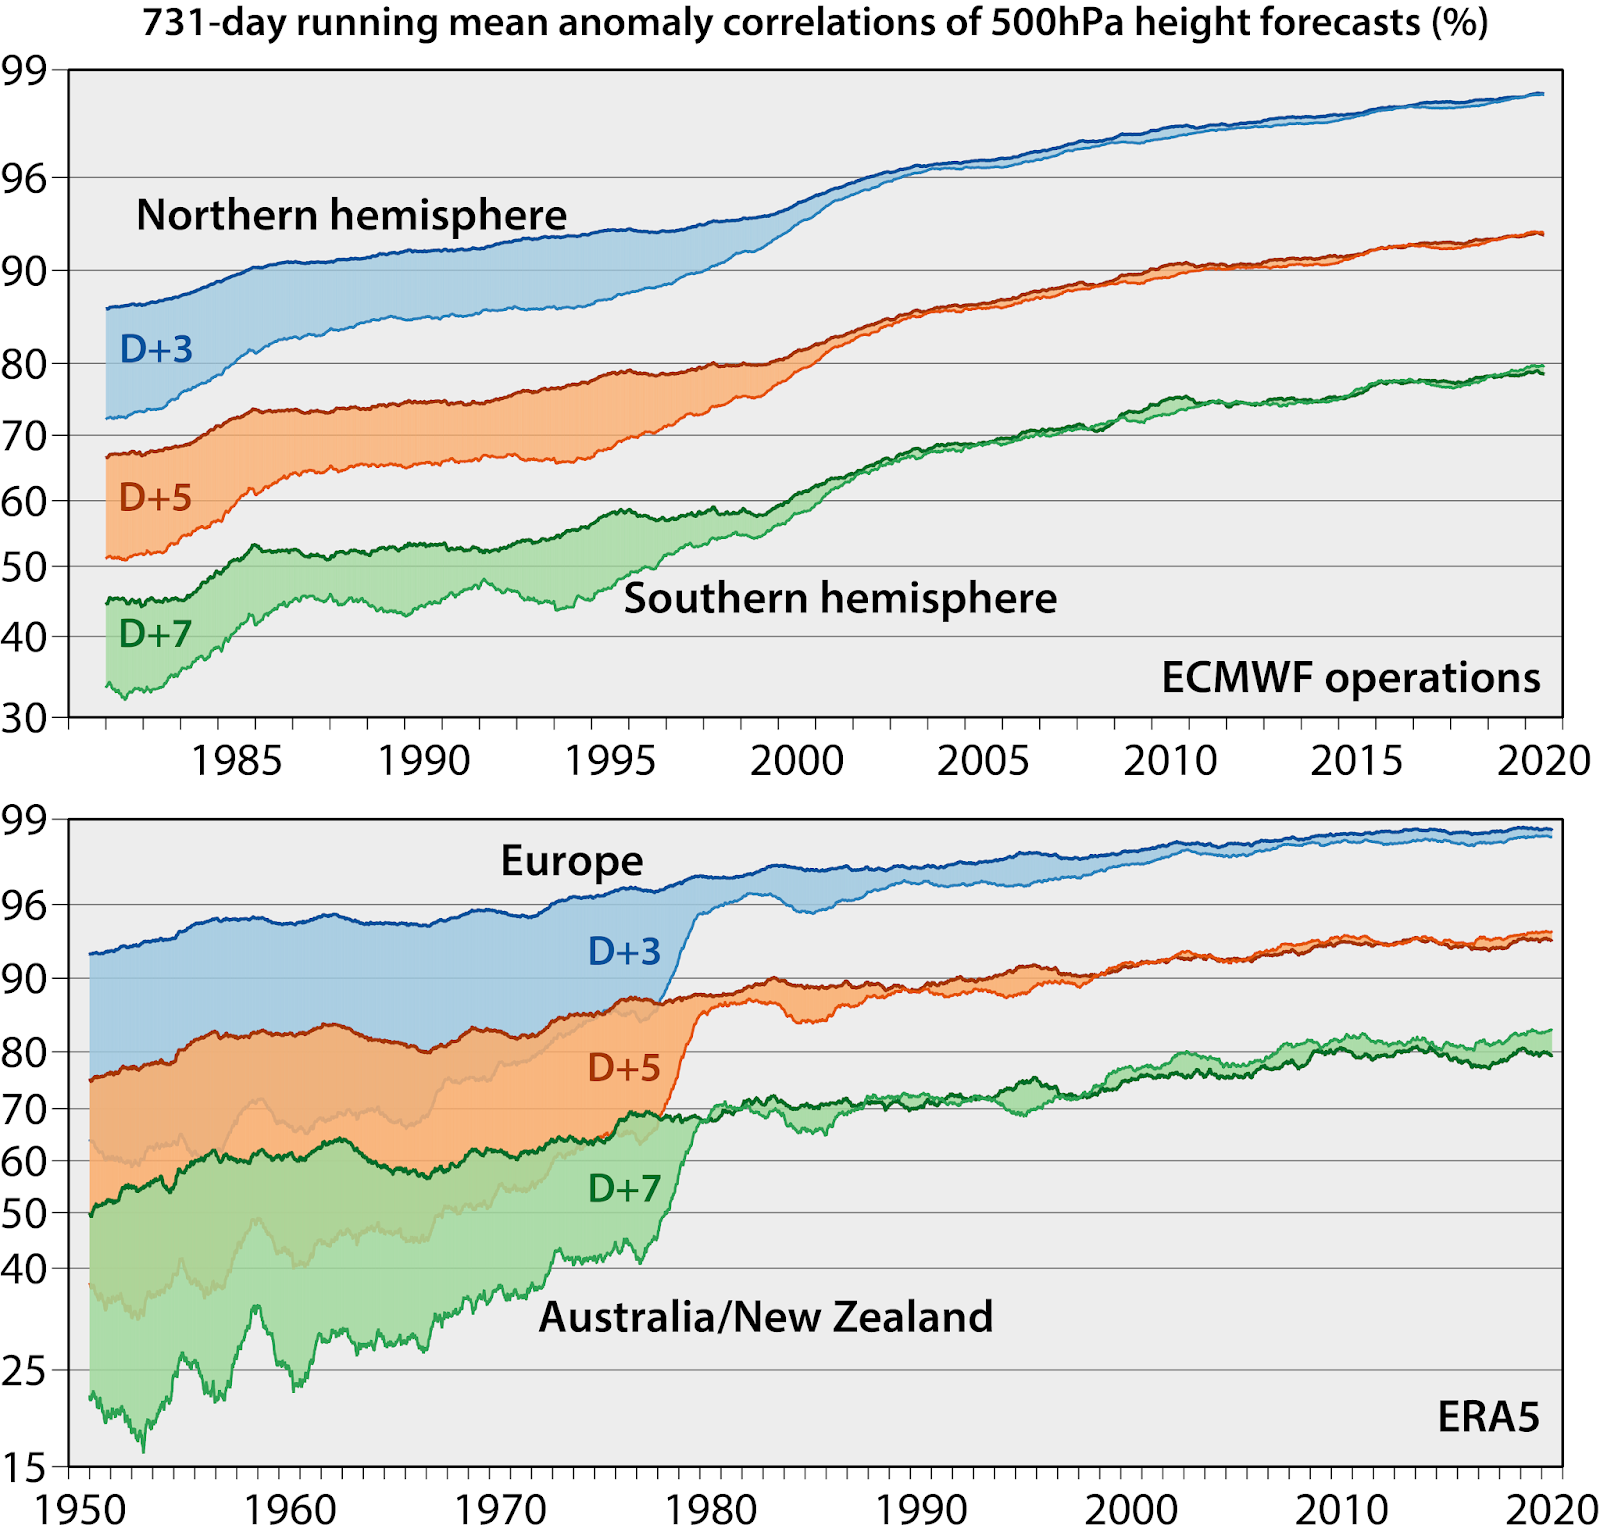
There are two stories here. First, the Northern hemisphere had much better accuracy, then converged. From what I can tell, this is mainly due to differences in available observations[16]. Second, despite the exponential increase in computational capacity with time (and all of the other improvements to our forecasting pipeline), we’ve only seen a corresponding linear increase in forecasting skill over time. This suggests to me that weather forecasting is a really hard problem! It also tells me that without advances in computing, we’d be very limited in what we can do[17].
Scientists aren’t done yet with forecasting. They are still working on understanding the atmosphere, increasing the quality and quantity of observations they can feed into their models, and improving the hardware they use to run their models. The hope is always making better predictions.
The story of progress in weather forecasting began with an insight: The weather is a physical system, so we can predict it using the laws of physics. But we can’t study the weather in a laboratory. Instead, it’s all around us, constantly evolving on local and global scales. The weather is such a vast system that it was initially a fantasy to hope we could ever predict it. But we did, and do every day. By combining scientific models with a worldwide observation system and massive computing power, we made weather forecasting into the operational infrastructure it is today. We activated its potential by making progress in all those areas, not just one or two. In other words: We created the right conditions for progress.
- ^
In this essay, I won’t focus on the vital step of communicating the forecasts to the public.
- ^
Page 1 of Lynch's book.
- ^
There was enough weather data for Richardson to carry out his forecast in a particular region.
- ^
Not only did Richardson carry out the calculation by hand, he did it while working for the Friends Ambulance Unit in France during World War I. As Richardson explains, “The manuscript was revised and the detailed example of Ch. IX was worked out in France in the intervals of transporting wounded in 1916-1918. During the battle of Champagne in April 1917, the working copy was sent to the rear, where it became lost, to be re-discovered some months later under a heap of coal.” (p. xiii)
- ^
Page 219 of Richardson’s book.
- ^
Lynch makes the point that this wasn’t likely six continuous weeks, but 6 weeks ✕ 7 days ✕ 24 hours = 1008 hours of work. (p. 16)
- ^
Chapter 9 of his book.
- ^
Page 18 of his book.
- ^
Figure 4 of the paper.
- ^
Figure 3 of the paper.
- ^
Figures 6, 7, and 8.
- ^
Chapter 6.1-6.2 of Lynch’s book.
- ^
Observations aren’t just for weather prediction over a few days. Scientists also use them for studying and forecasting longer-term trends in the climate, for example.
- ^
Page 183 of Lynch’s book.
- ^
There were also big advances in meteorology such as Lorenz’s explorations into chaos and using multiple, slightly different initial conditions in forecasts to estimate uncertainty, but I think it’s difficult to argue against the computer revolution playing a huge role.
- ^
I don’t see why the computation would be worse in a particular hemisphere, unless you’re capping the computational capacity.
- ^
There are limits to how far out we can forecast the weather. However, we also care about other aspects such as resolution (Is the prediction for rain near my house, or am I just in the 20 km by 20 km square that will have rain somewhere?).